
Trend Bias Structure
指标
272 下载
版本 1.0, Jan 2026
Windows 版、Mac 版
5.0
评价:1
说明
问题:信息过载
大多数交易者失败是因为他们的图表被滞后指标和过多的线条所淹没。他们忽视了最重要的东西:市场结构。
解决方案:趋势偏向结构
该指标是cTrader平台上的“二合一”强大工具。它结合了专业级的摆动检测和一个客观的评分引擎,准确告诉您谁在控制市场。
主要特点:
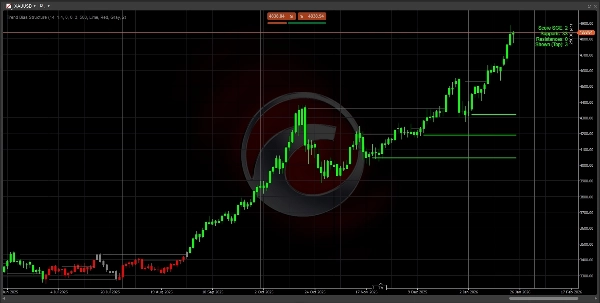
- 智能结构映射: 使用ATR过滤的波动性自动识别重要的支撑和阻力位。
- SGE评分引擎: 独特的评分系统(-2,0,+2),根据突破的结构水平数量计算趋势强度。
- 防杂乱技术: 仅显示距离当前价格最近的3个相关水平。您的图表保持清晰、专业且可操作。
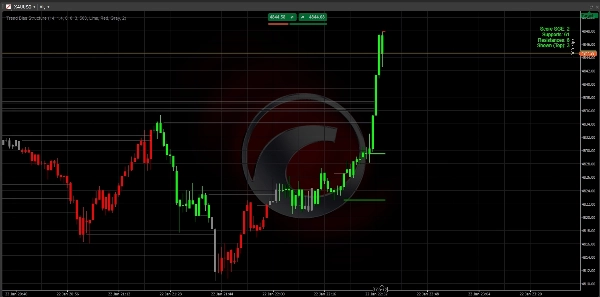
- 动量检测: 使用“大蜡烛”逻辑,确保您只交易有真实机构支持的走势。
- 完全可定制: 根据您的特定资产(XAUUSD、外汇或指数)调整灵敏度。
如何使用它进行交易:
- 查看评分: 寻找+2(看涨)或-2(看跌)。
- 等待回调: 让价格回到绘制的结构线之一。
- 执行: 按偏向交易,使用这些水平作为进出场锚点。
技术规格
- 平台: cTrader
- 语言: C# (.NET)
- 时间框架: 适用于所有时间框架(M1到月线)。
- 资产: 针对高流动性品种优化(XAUUSD、EURUSD、GBPUSD)。
注意:初始设置: 对于大多数主要品种,默认设置已优化。如果您交易波动较大的指数,可能需要将Range Global ATR Mult调高到2.0
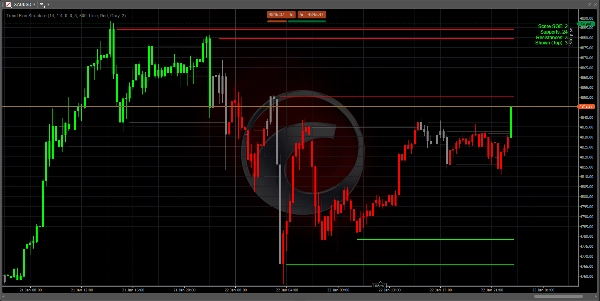
重要提示:读取仪表盘
右上角的仪表盘是您的指挥中心:
- 评分 +2(绿色): 强烈看涨。只寻找买入信号。
- 评分 -2(红色): 强烈看跌。只寻找卖出信号。
- 评分 0(灰色): 中性。市场处于盘整或过渡阶段。保持耐心。
- 支撑/阻力: 显示当前趋势中存在多少历史“地板”和“天花板”。
三步入场策略
步骤1:识别偏向 等待蜡烛颜色和仪表盘评分达到+2或-2。这确认市场已突破结构,趋势开始。
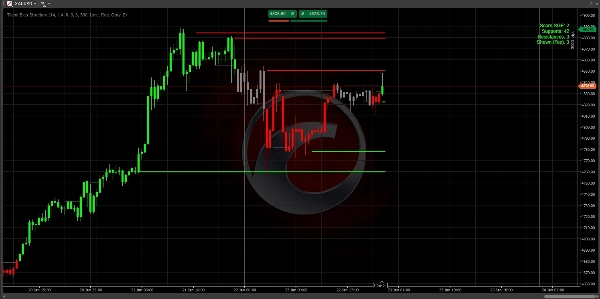
步骤2:价值区 不要追价。等待价格回调(回撤)到图表上绘制的最近3条线之一。
- 在下跌趋势中(评分-2),等待价格触及红线。
- 在上涨趋势中(评分+2),等待价格触及绿线。
步骤3:执行 当价格触及该线并显示拒绝信号(形成影线)时进场。
- 止损: 将止损设置在结构线后方。
- 止盈: 目标为趋势方向上的下一个结构线。
成功的专业技巧
- 高时间框架规则: H4或D1图表上的+2评分比M5图表上的评分更有力。使用高时间框架确定偏向,低时间框架寻找入场点。
- 清晰的图表: 如果屏幕显得杂乱,进入设置并将
Max Levels to Show设置为2。这将只显示最关键的“地板”和“天花板”。 - “零”区: 当评分为0时,市场处于“重新计算”状态。这是从之前交易中获利并等待新突破的最佳时机。
故障排除
- 没有线条显示? 检查您的图表是否加载了足够的历史数据。该指标至少需要100-200根K线来计算ATR和摆动水平。
- 指标延迟? 如果您的电脑运行缓慢,请将
Max Historical Lines设置减少到200以加快内存清理。
常见问题解答(FAQ)
问:该指标会重绘吗?
答: 不会。水平和评分基于确认的蜡烛收盘价计算。一旦某个水平被突破或评分在蜡烛收盘时发生变化,它将被锁定在历史中。
问:哪个时间框架最好?
答: 逻辑是通用的。然而,大多数专业交易者在H1、H4或日线图表上使用它来识别“机构结构”。如果您在M1或M5上进行剥头皮交易,预计评分变化会更频繁。
问:我可以与其他指标一起使用吗?
答: 可以!它作为“方向过滤器”工作得非常好。例如,只有当趋势偏向评分为+2时,才接受RSI超卖信号。
祝交易顺利!
非财务建议。 趋势偏向结构指标是一种技术分析工具,旨在帮助交易者识别市场结构和趋势偏向。
摘要
AI 摘要
Trend Bias Structure is a technical indicator for the cTrader platform designed to automatically identify professional market structure and provide a real-time "Bias Score" reflecting trend strength based on institutional breakout logic. It combines swing detection with a scoring engine that grades trend bias as +2 (strong bullish), -2 (strong bearish), or 0 (neutral/ranging).
Key features include:
- Smart Structure Mapping: Automatically detects significant support and resistance levels filtered by ATR-based volatility.
- SGE Scoring Engine: Calculates trend strength by counting breached structural levels.
- Anti-Clutter Display: Shows only the three closest relevant levels to maintain chart clarity.
- Momentum Detection: Uses "Big Candle" logic to highlight moves with institutional backing.
- Customizable sensitivity for different assets such as XAUUSD, EURUSD, GBPUSD, and indices.
The indicator works on all timeframes from 1 minute to monthly, with professional traders typically using H1, H4, or daily charts to identify institutional structure. The dashboard provides a clear bias score and structural levels to guide trade entries and exits. Users are advised to trade with the bias, waiting for price pullbacks to the nearest structure lines before executing trades.
This tool is intended as a directional filter and can be combined with other indicators like RSI. It does not repaint, as calculations are based on confirmed candle closes.
指标配置
客户评价
5.0
评价:1
5 | 100 % | |
4 | 0 % | |
3 | 0 % | |
2 | 0 % | |
1 | 0 % |
客户评价
February 18, 2026
Trend Bias Structure effectively identifies and visualizes market direction and structural bias. Signals are clear, stable and non-repainting. Best used on M10-H1 where balance of signal and readability is optimal. A strong trend filter and bias indicator for systematic traders.
讨论
常见问答
Forex
Breakout
Scalping
Indices
EURUSD
GBPUSD
RSI
XAUUSD
ATR
cTrader Store 提供的所有产品,包括交易机器人、指标和插件,均由第三方开发者提供,仅供信息参考和技术访问之用。cTrader Store 并非经纪商,不提供投资建议、个人推荐或任何未来业绩保证。
该作者的其他作品


猜您喜欢


!["[Stellar Strategies] MARSI Signal Plotter" 标识](https://cdn.ctrader.com/image/webp/7b2b8da6-8f8e-4646-8d4a-4710c516c01e_25567)


价格
95.45M
交易量
1.3M
盈利点数
10
销售
1.05K
免费安装