
Volume Meter
指标
2 购买
版本 1.0, Sep 2025
Windows 版、Mac 版
5.0
评价:1
说明
📘 该指标的功能
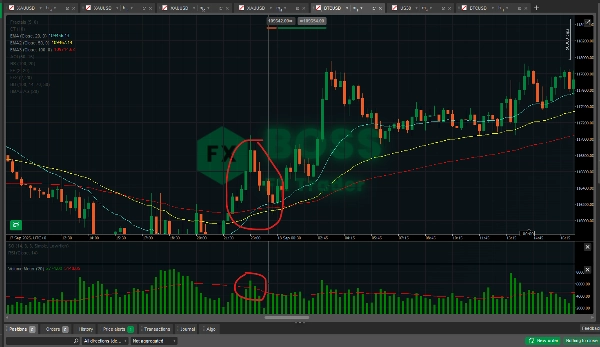
- 它显示 Tick 量(每根K线的价格变动次数)以直方图形式。
- 在外汇市场,经纪商很少提供 真实交易量,因此使用Tick量作为替代。
- 在股票/差价合约/期货市场,您可能获得真实交易量。
- 它叠加了一个 成交量的移动平均线(默认20周期)。
- 这作为“基线”,帮助快速判断当前K线的成交量是否异常高或低。
🎯 如何用作确认信号
该指标 不是独立的信号生成器。交易者用它来确认其他策略的设定:
- 突破确认
-
- 如果价格突破阻力位或跌破支撑位,检查突破K线的 成交量是否高于其移动平均线。
- 高成交量确认更多参与者支持该走势 → 突破更可靠。
- 低成交量突破 = 更高的假突破风险。
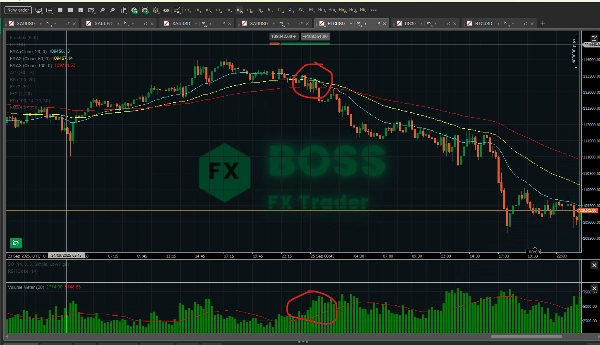
- 趋势延续与疲劳
-
- 在强趋势中,回调K线的 成交量通常低于冲击K线。
- 如果回调发生在低成交量且下一波上涨伴随更高成交量 → 确认趋势延续。
- 如果看到趋势推动持续但 每次推动成交量递减 → 可能疲劳,准备反转。
- 反转确认
-
- 大反转K线(针形线、吞没线、分形)如果伴随 成交量激增则更强。
- 例如:支撑位的看涨针形线伴随高成交量 = 比低成交量的同类针形线更强的反转信号。
- 假信号过滤器
-
- 如果您的主系统发出买入/卖出信号,但成交量较弱(低于平均),您可能选择放弃该交易。
- 有助于减少过度交易和过滤噪音。
📊 有效性
- 在外汇市场:Tick量已被证明与真实交易量高度相关(许多研究中相关系数为70–90%)。因此它有用,但并不完美。
- 在股票/期货/差价合约市场:真实成交量使其更强大,因为您测量的是实际交易的合约/股票数量。
- 作为确认工具:最好与 价格行为和其他指标(例如EMA、RSI、分形)结合使用。单独依赖成交量风险较大。
- 优点:确认突破,过滤假动作,识别疲劳。
- 缺点:自身不预测方向 — 仅在已有设定时增加信心。
✅ 实用提示:
将该指标用作 过滤器,而非触发器。例如:
- 您看到EMA交叉(买入信号)。
- 检查:成交量是否高于其移动平均线?如果是 → 执行交易。如果不是 → 等待。
这样,您只有在动能得到市场参与支持时才交易。
摘要
AI 摘要
Volume Meter is a trading indicator that displays tick volume—the number of price changes per bar—as a histogram. In Forex markets, where real traded volume data is often unavailable, tick volume serves as a proxy, while in stocks, CFDs, and futures, real volume data may be used. The indicator overlays a moving average of volume (default 20-period) to provide a baseline, helping traders identify whether current volume is unusually high or low.
This tool is designed to confirm trading setups rather than generate standalone signals. It assists in validating breakouts by checking if breakout candles have volume above their moving average, indicating stronger market participation. It also helps distinguish trend continuation from exhaustion by comparing volume levels during pullbacks and impulse moves. Additionally, it supports reversal confirmation by highlighting volume spikes on significant reversal candles and filters false signals by advising caution when volume is weak despite buy or sell signals from other systems.
Volume Meter is applicable across various markets including Forex, stocks, indices, commodities, and cryptocurrencies. Its effectiveness is enhanced when combined with price action and other indicators such as EMA or RSI. The indicator aids in improving trade decision confidence by integrating volume analysis as a confirmation and filtering tool.
指标配置
客户评价
5.0
评价:1
5 | 100 % | |
4 | 0 % | |
3 | 0 % | |
2 | 0 % | |
1 | 0 % |
客户评价
October 1, 2025
the first 10 trades should stay boring, and the checklist becomes easier to follow.
讨论
常见问答
BTCUSD
Forex
Breakout
Indices
EURUSD
Commodities
GBPUSD
NZDUSD
Prop
Supertrend
Crypto
Stocks
XAUUSD
NAS100
USDJPY
cTrader Store 提供的所有产品,包括交易机器人、指标和插件,均由第三方开发者提供,仅供信息参考和技术访问之用。cTrader Store 并非经纪商,不提供投资建议、个人推荐或任何未来业绩保证。
该作者的其他作品


价格
注册日期 29/05/2025
3.04M
交易量
45.22K
盈利点数
29
销售
768
免费安装