
Double Top and Bottom Pivots
インジケーター
131 ダウンロード数
バージョン 1.0、Feb 2026
Windows、Mac
説明
LogicLadder Pivots – 高度な市場構造&パターンスキャナー
LogicLadder Pivotsで市場の隠れた構造を解き明かしましょう。
このLogicLadder Pivotsインジケーターは、トレーダーが市場構造を視覚化し、トレンドを特定し、高確率の反転パターンを自動的に検出するのを支援するプロフェッショナルグレードのプライスアクションツールです。クラシックなジグザグロジックと高度なマルチタイムフレーム監視を組み合わせることで、このツールはあなたのパーソナル市場アナリストとして機能し、チャートをすっきり保ちながら重要な価格変動を知らせます。
🚀 主な特徴
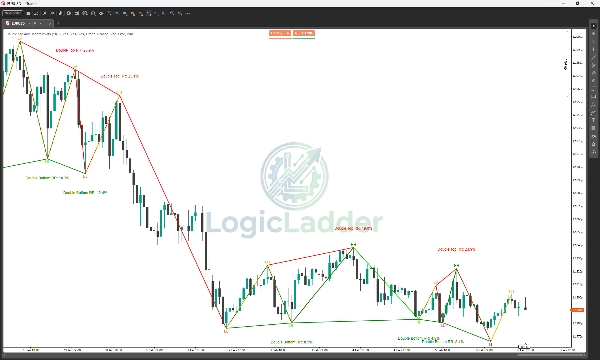
- 自動市場構造: 自動的に高値更新 (HH)、高値切下げ (LH)、安値切上げ (HL)、および安値更新 (LL)をラベル付けし、現在のトレンド方向を即座に把握できます。
- スマートパターン検出: リアルタイムでダブルトップおよびダブルボトムの形成をスキャンします。単にパターンを見つけるだけでなく、計算されたリスク対リワード (RR)比率に基づいてフィルタリングし、最も実行可能なセットアップのみを表示します。
- マルチタイムフレーム (MTF) アラート: 低い時間軸で取引しながら、高い時間軸(例:H4や日足)を監視します。ウォッチャー時間軸で重要なピボットが形成されるとインジケーターが通知し、主要トレンドに逆らって取引することを防ぎます。
- インタラクティブ統計パネル: クリーンなチャート上のダッシュボードに、パターン検出の現在の状態(スキャン中、ダブルトップ検出など)を表示します。
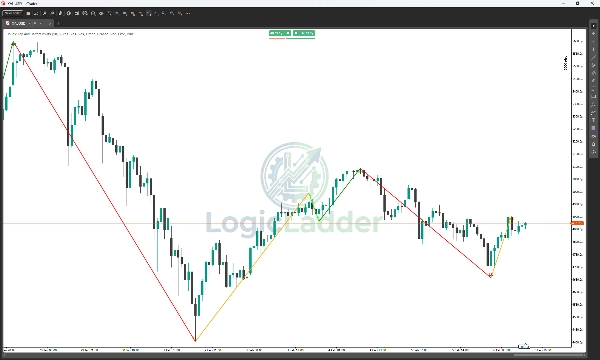
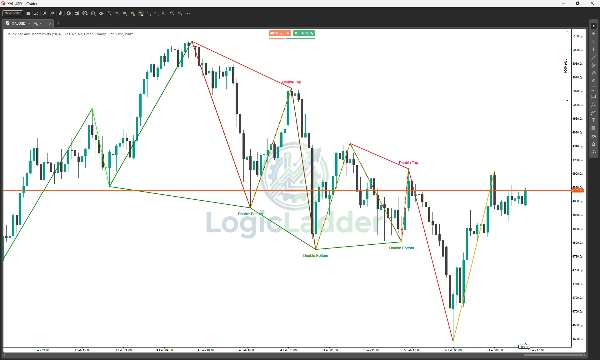
- ジグザグ可視化: ノイズを切り抜ける明確でカスタマイズ可能なトレンドラインを描画し、重要な価格変動に集中できます。
- 完全カスタマイズ可能: インジケーターのあらゆる側面をあなたの取引スタイルに合わせて調整可能。ピボット感度(長さ)を調整し、強気/弱気構造の色を変更し、異なる視覚要素のオンオフを切り替えられます。
🎨 ビジュアルガイド&カラーストラテジー
このLogicLadderシステムは、市場構造の物語を瞬時に伝える特定の4色コードを使用しています。以下は「ラダー」の読み方です:
1. 🟢 緑(強気 - 強い)
- 何を示すか: 高値更新 (HH)に使用されます。
- 意味: 買い手が完全に支配しています。市場は新高値を更新しています。
- 行動: 買いの機会を探すか、既存のロングポジションを保持してください。
2. 🔴 赤(弱気 - 強い)
- 何を示すか: 安値更新 (LL)に使用されます。
- 意味: 売り手が完全に支配しています。市場は新安値に急落しています。
- 行動: 売りの機会を探すか、既存のショートポジションを保持してください。
3. 🟠 オレンジ(ブルトラップ - 弱さ)
- 何を示すか: 高値切下げ (LH)に使用されます。
- 意味: 買い手が価格を押し上げようとしましたが、前の高値を突破できませんでした。これは「ブルトラップ」で、遅れて買った買い手が勢いの衰えにより罠にかかっています。
- 行動: 警告サイン!ロングの場合は利益確定を検討してください。下方向へのトレンド反転の可能性に注意しましょう。
4. 🟢 ライム(ベアトラップ - 強さ)
- 何を示すか: 安値切上げ (HL)に使用されます。
- 意味: 売り手が価格を押し下げようとしましたが、前の安値を突破できませんでした。これは「ベアトラップ」で、遅れて売った売り手がサポートにより罠にかかっています。
- 行動: チャンスのサイン!これは新たな上昇トレンドの始まりを示すことが多いです。ロングのエントリーシグナルに注目しましょう。
📉 「ラダー」の取引方法
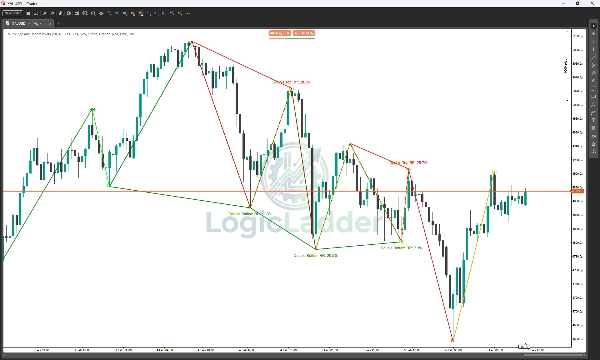
- 上昇トレンドモード: 緑 (HH)がライム (HL)と連結しているパターンを見たいです。これは健全な上昇ラダーを確認します。
- 下降トレンドモード: 赤 (LL)がオレンジ (LH)と連結しているパターンを見たいです。これは急激に下落するラダーを確認します。
- 反転の見極め:
-
- 潜在的なトップ: 緑 (HH)の直後にオレンジ (LH)が現れると、上昇トレンドの勢いが失われています。
- 潜在的なボトム: 赤 (LL)の直後にライム (HL)が現れると、売り圧力が尽きています。
💡 仕組み
- ピボット分析: インジケーターはユーザー定義の遡及期間(デフォルト:10バー)を分析し、重要なスイング高値と安値を特定します。
- トレンドロジック: これらのポイントをつなげて価格の「ラダー」を視覚化し、トレンドが構造を破っているか、サポート/レジスタンスを尊重しているかを正確に示します。
- 反転確認: 価格アクションが「W」(ダブルボトム)または「M」(ダブルトップ)構造を形成し、リスク/リワード基準を満たすと、インジケーターはチャートにパターンを描画し、ステータスパネルを更新します。
🔔 アラート&通知
画面を見続けなくても情報を得られます。LogicLadder Pivotsには強力なアラートシステムが含まれています:
- ログアラート: パターンやピボットが発生した際にcTraderログに詳細なメッセージを出力します。
- MTF監視: 選択したアラート時間軸で構造的なピボット高値または安値が形成されると通知を受け取れます(例:5分足でスキャルピング中に4時間足のピボット安値のアラートを受け取る)。
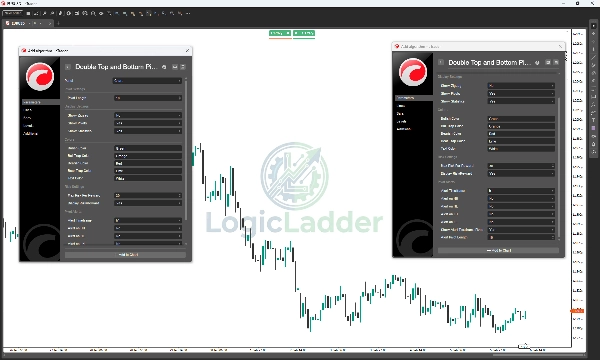
⚙️ パラメーター
- ピボット長さ: スイング検出の感度。
- ラベルオフセット: テキストラベルをローソク足のヒゲからの距離を調整し、視認性を向上させます。
- 最大リスク対リワード: 効率に基づいてパターンをフィルタリングします(デフォルト:30%)。
- アラート時間軸: 監視するセカンダリ時間軸を選択します。
- ビジュアル設定: 強気、弱気、およびトラップの動きの色を完全にコントロールできます。
概要
AIによる概要
The Double Top and Bottom Pivots indicator, known as LogicLadder Pivots, is a professional price action tool designed to analyze market structure and identify trend directions automatically. It uses advanced ZigZag logic combined with multi-timeframe (MTF) monitoring to label key pivot points such as Higher Highs (HH), Lower Highs (LH), Higher Lows (HL), and Lower Lows (LL). This labeling helps traders quickly assess market trends.
The indicator detects Double Top and Double Bottom reversal patterns in real-time, filtering them by a calculated Risk-to-Reward ratio to highlight the most actionable setups. It supports alerts for pivot formations on higher timeframes while trading on lower ones, helping users align trades with major trends.
A customizable on-chart stats panel displays the current pattern detection status, and clear ZigZag trend lines visualize significant price swings. Users can adjust pivot sensitivity, label positioning, and color schemes for bullish, bearish, and trap moves to fit their trading style.
The tool employs a four-color system to represent market conditions: green for strong bullish moves (HH), red for strong bearish moves (LL), orange for bull traps (LH), and lime for bear traps (HL). This visual guide aids in spotting trend continuations and potential reversals. Alerts include detailed log messages and MTF notifications to keep traders informed.
インジケーターのプロフィール
カスタマーレビュー
0.0
レビュー: 0
カスタマーレビュー
この商品にはまだレビューがありません。お使いになったことがある方は、ぜひレビューをお願いします。
ディスカッション
よくあるご質問
Signal
ZigZag
Scalping
cTrader Storeで入手可能な取引ボット、インジケーター、プラグインなどの商品は、第三者の開発者が提供するものであり、情報と技術の取得のみを目的としてご利用いただけます。cTrader Storeはブローカーではなく、投資助言や個人的な推奨を行うことも、将来のパフォーマンスを保証することもありません。
この作成者の他の商品


価格
登録日 09/01/2026
704
無料インストール