Deskripsi
LogicLadder Smart SR Zones | Dukungan & Resistensi Profesional
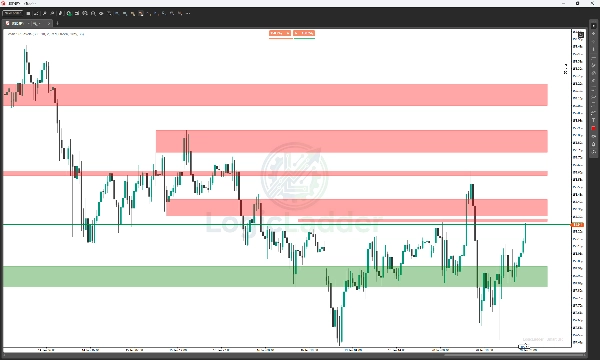
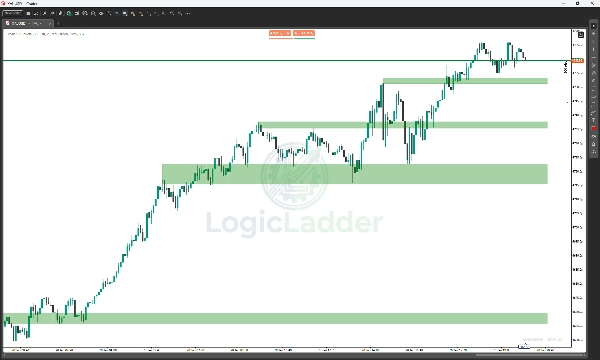
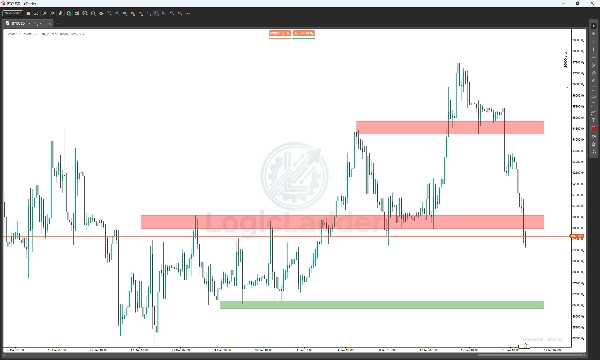
Berhenti menebak ke mana pasar akan berbalik. LogicLadder Smart SR memvisualisasikan zona institusional di mana harga kemungkinan akan bereaksi. Dirancang untuk trader Price Action, indikator ini langsung menyoroti "lantai" dan "langit-langit" pasar, memungkinkan Anda fokus pada eksekusi daripada analisis.
Sempurna untuk strategi Break & Retest: Saksikan saat zona Support Hijau berubah menjadi Merah segera setelah breakdown, memberi Anda konfirmasi visual yang jelas untuk mencari setup jual.
Mengapa menggunakan Smart SR?
- Kejelasan Visual: Langsung lihat di mana pembeli dan penjual menunggu.
- Kurangi Kebisingan: Filter "Pivot Strength" mengabaikan kebisingan pasar kecil, hanya menunjukkan level yang penting.
- Tidak Ada Repainting: Apa yang Anda lihat di grafik adalah apa yang sebenarnya terjadi.
- Sepenuhnya Dapat Disesuaikan: Sesuaikan warna, transparansi, dan periode look-back agar sesuai dengan gaya trading pribadi Anda.
Tips Trading: Tunggu harga mendekati zona "Segar" (abu-abu). Jika harga memantul, masuklah searah tren. Jika harga menembus, tunggu perubahan warna (Merah/Hijau) dan tradinglah pada retest.
Opsi 3: Singkat & Padat (Terbaik untuk Media Sosial / Discord)
Gunakan ini untuk berbagi cepat.
Judul: LogicLadder Smart SR Zones
Deskripsi: Otomatiskan analisis teknikal Anda dengan Smart SR Zones. Indikator cTrader ini mendeteksi titik Pivot utama dan menggambar kotak Support & Resistance yang akurat yang diperbarui secara real-time.
✅ Pengalihan Warna Otomatis: Zona berubah Merah/Hijau saat breakout.
✅ Tanpa Lag: Zona lama dihapus otomatis agar grafik tetap cepat.
✅ Tidak Ada Repainting: Anchor berbasis waktu yang tetap.
✅ UI Bersih: Transparansi dan gaya profesional.
Ringkasan
Key features include:
- Visual clarity with clear identification of buyer and seller zones.
- A "Pivot Strength" filter that reduces market noise by showing only significant levels.
- No repainting, ensuring that displayed zones reflect actual historical price action.
- Full customization options for colors, transparency, and look-back periods.
- Automatic deletion of outdated zones to maintain chart performance.
- Support for break and retest trading strategies by signaling zone flips after breakouts.
The indicator supports multiple markets including Forex, indices, commodities, stocks, and cryptocurrencies, with tags referencing popular symbols like BTCUSD, EURUSD, GBPUSD, XAUUSD, NAS100, and USDJPY. It provides a clean, professional user interface optimized for efficient technical analysis.