説明
概要
バランス・オブ・パワー指標は、買い手と売り手の強さを、それぞれの価格を極端なレベルに押し上げる能力を評価することで測定します。
2001年8月号のTechnical Analysis of Stocks & Commodities誌でイゴール・レフシンによって紹介されたBOPは、各バーのレンジ内の価格変動の比率を計算し、価格の方向性に依存しない内部の強さの動態を明らかにします。
コンセプト
バランス・オブ・パワーは、各バーのレンジ内で価格がどこで終値をつけるかを測定し、買い手と売り手の内部の戦いを明らかにします。
基本原理はシンプルです:買い手は価格を高値に押し上げ、売り手は安値に押し下げます。そのレンジ内で最終的に価格がどこで終わるかが、その取引期間を支配したのが誰かを示します。
生の値は移動平均で平滑化され、ノイズを減らし持続的な方向性の圧力を明らかにし、不規則なバーごとの読み取りを市場支配の変化を追跡するクリーンなモメンタムゲージに変換します。
マーケット構造への応用
BOPは価格構造を確認または矛盾させる内部の強さの分析を提供します:
トレンドフェーズの識別
- 強い上昇トレンド: BOPが常にゼロ以上で、より高い安値を示す
- 強い下降トレンド: BOPが常にゼロ以下で、より低い高値を示す
- 統合期: BOPがゼロラインの周りで振動する
- 移行ゾーン: BOPが以前の構造(より高い高値/より低い安値)を破る
サポート/レジスタンスの合流
- BOPがゼロに戻ることは、価格が重要なレベルをテストすることとしばしば一致します
- BOPの極端な読み取り(+0.8から+1.0または-0.8から-1.0)は、構造付近の疲労を示す可能性があります
- 構造レベルでのダイバージェンスは、拒否または突破の可能性を示唆します
分配/蓄積
- 価格が上昇しBOPが低下している場合:潜在的な分配フェーズ
- 価格が下落しBOPが上昇している場合:潜在的な蓄積フェーズ
- これらのダイバージェンスは主要な構造レベル付近で最も重要です
マルチタイムフレーム戦略
BOPを複数の時間枠で使用することで、コンテキストと精度を提供します:
1. 高時間枠(HTF) - 方向性バイアス:
- 日足/4時間足のBOPがゼロ以上 → 低時間枠で買いの機会を探す
- 日足/4時間足のBOPがゼロ以下 → 低時間枠で売りの機会を探す
- HTFのBOPがゼロを横断 → 主要なトレンドシフト、確認を待つ
2. 低時間枠(LTF) - エントリータイミング:
- 1時間/15分のBOPがHTFと一致 → 高確率のセットアップ
- LTFのBOP/シグナルのクロスオーバーがHTFの方向と一致 → エントリートリガー
- LTFのヒストグラムの拡大がモメンタムを確認
3. 時間枠の整合:
- すべての時間枠が一致 → 最も強い確信の取引
- HTFとLTFが乖離 → 解決を待つか取引を避ける
- LTFがHTFに逆らう反転 → 反トレンドのスキャルピングのみの可能性
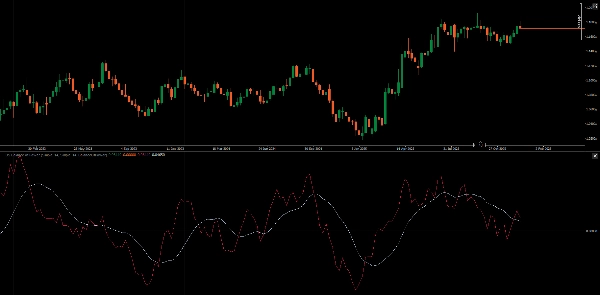
シグナルライン&ヒストグラム
シグナルライン(BOPのMA):
- BOP/シグナルのクロスオーバーはフィルタリングされたエントリー/エグジットシグナルを提供
- シグナルラインの傾きはモメンタムの持続性を示す
- BOPとシグナル間の距離は動きの拡張を示す
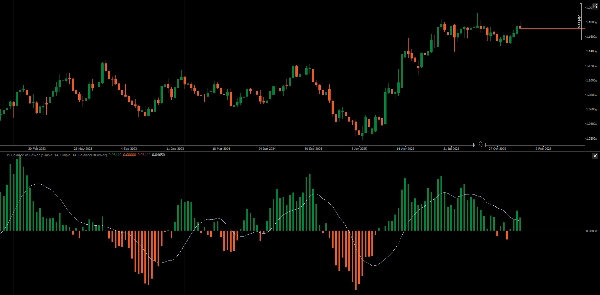
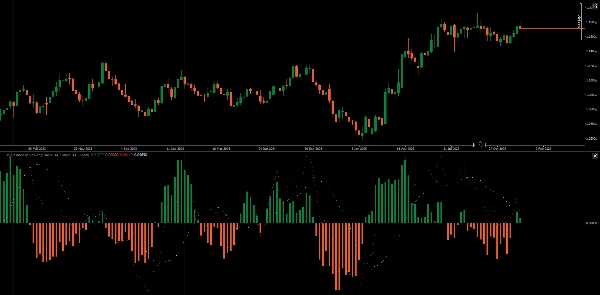
ヒストグラムモード:
- 値モード:ゼロに対するBOPの極性(買い手/売り手の優勢)を表示
- シグナルモード:BOP - シグナルの差を表示し、クロスオーバーより早くモメンタムの変化を明らかにする
シグナルモードでは、ヒストグラムのゼロラインのクロスオーバーがBOP/シグナルラインのクロスオーバーより先に発生し、モメンタム変化の早期警告を提供します。
特徴
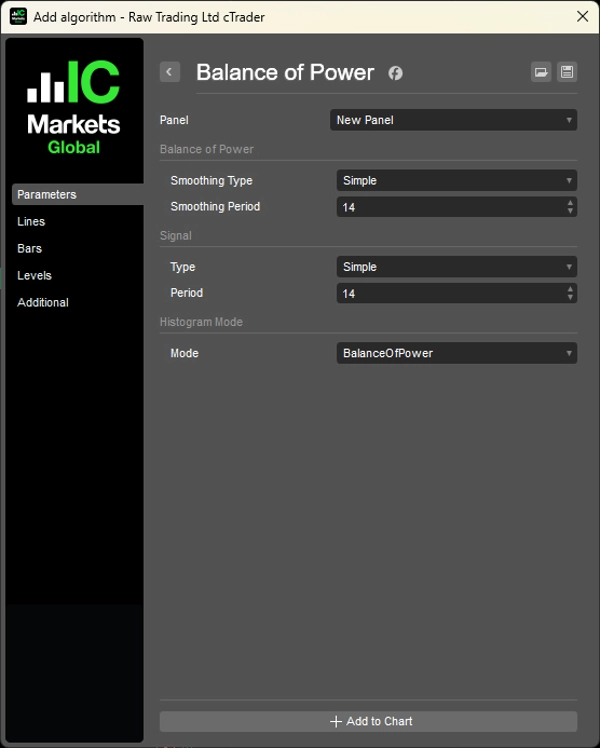
- 平滑化期間:BOPの調整可能なMA期間(デフォルト14)
- 平滑化タイプ:MAタイプの選択(SMA、EMAなど)
- シグナル期間:シグナルラインの調整可能なMA期間(デフォルト14)
- シグナルタイプ:シグナルラインのMAタイプの選択
- ヒストグラムモード:値表示とシグナル差表示の切り替え
実用例
- HTF(日足):BOPがゼロ以上で上昇 → 強気バイアス
- 価格がサポートに戻る
- LTF(1時間足):BOPがシグナルを上抜け → エントリートリガー
- ヒストグラム(シグナルモード)が拡大 → モメンタム加速を確認
- LTFのヒストグラムが収縮するかBOPがシグナルを下抜けたら終了
__________________________________________________________________________________________
その他の無料インジケーター
構造やボリュームから回帰、ボラティリティ、カスタム時間枠まで、幅広い市場分析ツールを探索してください。
ソースコードはGitHubのリポジトリで入手可能です。
すべて無料で使用できますが、コーヒーサポートを送りたい場合はこちらからどうぞ。
サポート/レジスタンス
ボリューム
移動平均
- SSLチャネル
- アンカード移動平均
- 偏差スケール移動平均
- ギャン高低アクティベーター
- 瞬時トレンドライン
- カウフマン適応MAとトレンドビジョン
- 移動平均チャネル
- 移動平均スイート
- トレンドチャネル移動平均
ユーティリティ/カスタム
回帰ベース
ボラティリティ
オシレーター
__________________________________________________________________________________________
免責事項
取引にはリスクが伴います。このインジケーターは技術分析専用であり、常に適切なリスク管理を行い、責任を持って取引してください。
フィードバック&改善
ご提案や機能リクエスト、改善のアイデアがあれば、ディスカッションタブにコメントを残してください。皆様のフィードバックがインジケーターの改善に役立ちます。
概要
Key functionalities include identifying trend phases—strong uptrends, downtrends, consolidation, and transition zones—by observing BOP behavior relative to the zero line. It also aids in detecting support and resistance confluence, with extreme BOP readings indicating potential exhaustion near key levels and divergences signaling possible rejections or breakthroughs. The indicator helps identify distribution and accumulation phases through price and BOP divergences.
BOP supports multi-timeframe analysis: higher timeframes provide directional bias, while lower timeframes offer entry timing signals via BOP and signal line crossovers and histogram momentum confirmation. The signal line is a moving average of BOP, with crossovers serving as filtered entry/exit triggers. The histogram can display either BOP polarity or the difference between BOP and its signal line, offering early momentum shift warnings.
Adjustable parameters include smoothing periods and types for both BOP and signal lines, and histogram display modes. The indicator is applicable across Forex, indices, commodities, cryptocurrencies, and stocks markets.