
Описание
Профиль объёма сессии HD
Что это делает
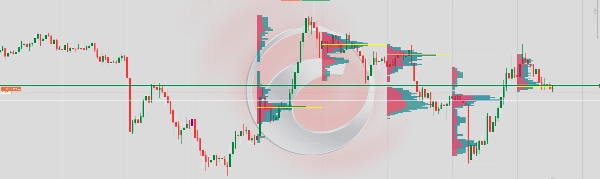
Отображает горизонтальный профиль объёма для каждой торговой сессии непосредственно на графике. Показывает, как объём торгов распределён по ценовым уровням, помогая трейдерам выявлять зоны высокой активности, области справедливой стоимости и ключевые уровни поддержки/сопротивления, основанные исключительно на поведении объёма.
Как это работает
При закрытии каждого нового бара индикатор сканирует все бары в пределах заданного количества сессий и распределяет тиковый объём каждого бара по его ценовому диапазону. Объём разделяется на покупательскую сторону (бычьи бары) и продавцовую сторону (медвежьи бары) с использованием направления открытия/закрытия бара в качестве приближения. Результат отображается в виде многослойной горизонтальной гистограммы, привязанной к временной границе сессии.
Визуальные элементы
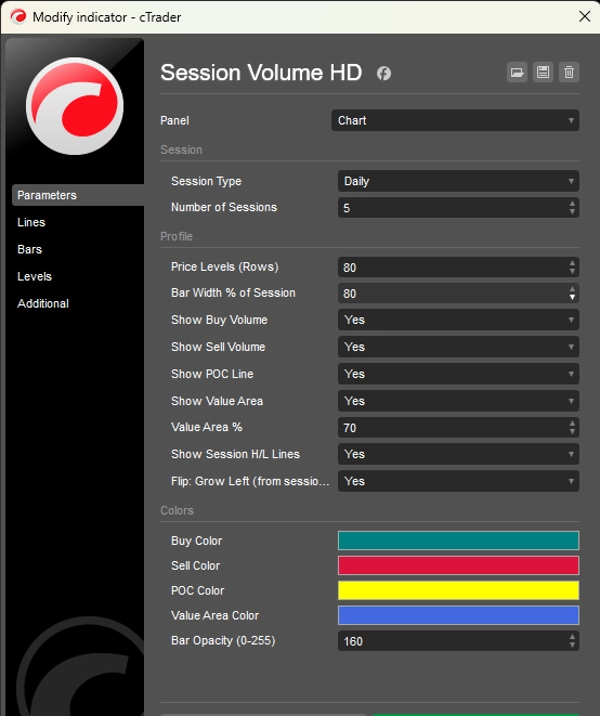
Бары покупок (бирюзовые) — показывают объём, торгуемый при бычьем движении цены на каждом уровне. Растут влево (или вправо, если перевернуты) от якоря сессии.
Бары продаж (красные) — показывают объём, торгуемый при медвежьем движении цены на каждом уровне, расположены рядом с барами покупок.
Линия POC (жёлтая) — Точка контроля. Горизонтальная линия, отмечающая ценовой уровень с наибольшим общим объёмом за сессию. Действует как магнит для цены.
Зона стоимости (синий наложение) — ценовой диапазон, содержащий настраиваемый процент (по умолчанию 70%) от общего объёма сессии. Представляет зону «справедливой стоимости», где происходило большинство торгов.
Линии максимума/минимума сессии (белые пунктирные) — отмечают наивысшую и наинизшую цену, достигнутые в течение сессии.
Производительность
Индикатор перерисовывается только один раз при закрытии нового бара, а не при каждом тике. Это устраняет мерцание и обеспечивает стабильное отображение даже при большом количестве сессий и высоком числе ценовых уровней.
Ограничения
Поскольку cTrader не предоставляет истинный объём бид/аск на уровне бара без потока тиковых данных, объём покупок/продаж приблизительно оценивается с использованием направления бара: бычьи бары оцениваются как 65% покупок / 35% продаж, медвежьи — наоборот, а бары доджи делятся поровну 50/50. Для получения истинного дельта-объёма потребуется подписка на тиковые данные.


