
WVAP-Bands Indicator_noSourceCode
Индикатор
1 покупки
Версия 1.0, Sep 2025
Windows, Mac
4.5
Отзывы: 2
Описание
VWAP Bands - Профессиональный анализ объема
Преобразите свою торговлю с точностью институционального уровня
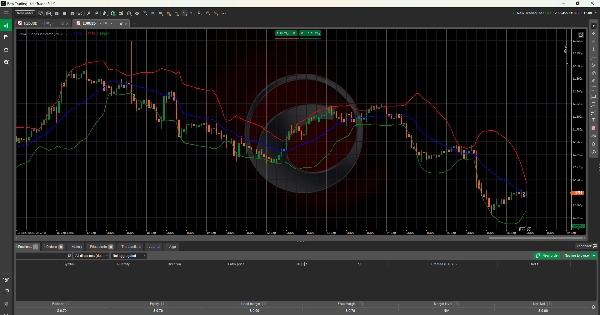
Индикатор VWAP Bands предоставляет профессиональный анализ цены с учетом объема с динамическими полосами стандартного отклонения. Используется институциональными трейдерами по всему миру для определения оптимальных точек входа и выхода.
🚀 Ключевые особенности
- Истинный расчет VWAP: Средневзвешенная цена по объему с использованием методологии HLC/3
- Динамические полосы: Верхние/нижние полосы на основе объемно-взвешенного стандартного отклонения
- Полная настройка: Регулируемые периоды, цвета и множители ширины полос
- Анализ в реальном времени: Обновляется с каждым баром для мгновенного понимания рынка
📊 Применение в торговле
- Перекупленность/перепроданность: Верхняя полоса = сигналы на продажу, Нижняя полоса = сигналы на покупку
- Динамическая поддержка/сопротивление: VWAP выступает в качестве институционального уровня отсчета
- Реверсия к среднему: Торговля разворотами при достижении ценой крайних значений полос
- Подтверждение тренда: Сильные прорывы через полосы сигнализируют о продолжении
⚙️ Профессиональные настройки
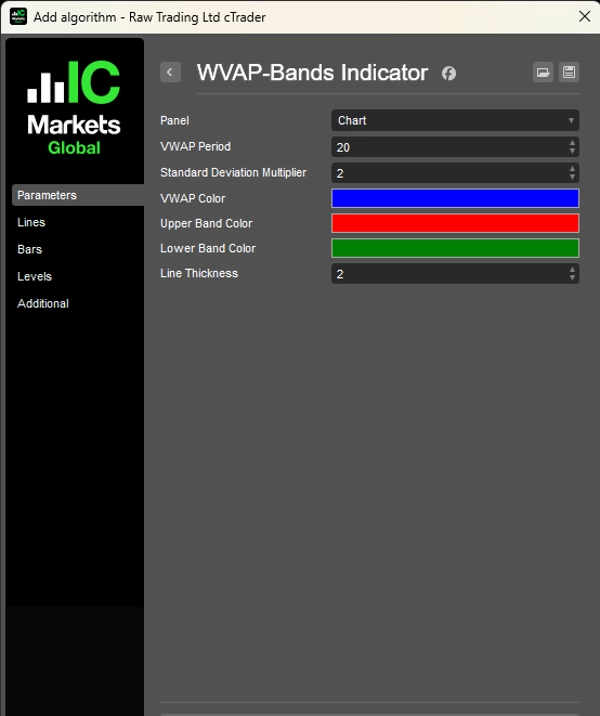
- Период VWAP: 1-200 баров (по умолчанию: 20)
- Стандартное отклонение: множитель 0.1-5.0 (по умолчанию: 2.0)
- Визуальная настройка: Пользовательские цвета и толщина линий
- Мультивременные рамки: Работает на всех таймфреймах и инструментах
✅ Почему VWAP Bands?
Превосходя простые скользящие средние, VWAP Bands обеспечивают:
- Точность с учетом объема для истинного институционального анализа
- Адаптивные полосы волатильности, которые подстраиваются под рыночные условия
- Профессиональная методология, используемая успешными трейдерами по всему миру
- Универсальное применение на форекс, акциях, криптовалютах и товарах
Идеально подходит для скальперов, дневных трейдеров и свинг-трейдеров, ищущих профессиональный анализ объема.
Совместимо с cTrader 4.0+. Работает со всеми инструментами и таймфреймами.
Сводка
ИИ-сводка
The WVAP-Bands Indicator provides volume-weighted average price (VWAP) analysis enhanced with dynamic standard deviation bands. It calculates VWAP using the HLC/3 price method and overlays upper and lower bands based on volume-weighted standard deviation, offering adaptive volatility measures. The indicator supports full customization of periods, colors, and band width multipliers, allowing traders to tailor it to their strategies. It updates in real time with each new bar, delivering immediate market insights.
Key trading applications include identifying overbought and oversold conditions (upper band signals sell, lower band signals buy), dynamic support and resistance levels with VWAP as an institutional reference, mean reversion opportunities when prices reach band extremes, and trend confirmation through breakouts beyond the bands. Settings allow adjustment of VWAP period (1–200 bars), standard deviation multiplier (0.1–5.0), and visual elements such as colors and line thickness.
The indicator is compatible with all timeframes and instruments, including forex, stocks, cryptocurrencies, commodities, and indices. It is designed for scalpers, day traders, and swing traders seeking professional-grade volume analysis and is compatible with cTrader 4.0 and above.
Профиль индикатора
Отзывы покупателей
4.5
Отзывы: 2
5 | 50 % | |
4 | 50 % | |
3 | 0 % | |
2 | 0 % | |
1 | 0 % |
Отзывы покупателей
October 4, 2025
The sample size matters. The useful metric is POC and VWAP first, compare the result with 20 reactions, and only scale if 2 sessions still looks controlled.
October 3, 2025
I liked it more as a extra filter for volume based context than as something to follow blindly. Pressure is easier to read, and the final decision still feels like it belongs to the trader. The next review on it on value area.
Обсуждение
Частые вопросы
BTCUSD
Forex
Signal
Breakout
Indices
EURUSD
Commodities
GBPUSD
NZDUSD
Prop
Scalping
Crypto
Stocks
XAUUSD
NAS100
USDJPY
VWAP
Продукты, доступные в cTrader Store, включая торговых ботов, индикаторы и плагины, предоставляются сторонними разработчиками и доступны исключительно в информационных и технических целях. cTrader Store не является брокером и не предоставляет инвестиционные консультации, персональные рекомендации или какие-либо гарантии будущей доходности.
Больше от этого автора


Цена
С 15/01/2025
7
Продажи