
Footprint Chart_noSourceCode
Индикатор
1 покупки
Версия 1.0, Sep 2025
Windows, Mac
4.3
Отзывы: 3
Описание
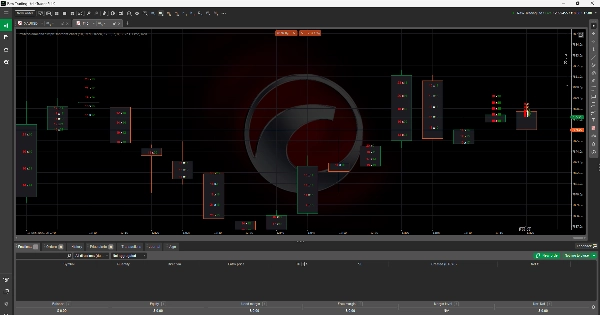
Индикатор Footprint Chart
Индикатор Footprint Chart предоставляет трейдерам подробный обзор потока ордеров, отображая объемы заявок на покупку и продажу непосредственно внутри каждой свечи цены. В отличие от традиционных свечных графиков, этот инструмент позволяет пользователям видеть, где сосредоточено давление покупателей и продавцов на конкретных ценовых уровнях. Подчеркивая дисбалансы между покупателями и продавцами, он предлагает более глубокое понимание глубины рынка, ликвидности и торговой активности. Это делает его незаменимым инструментом для трейдеров, стремящихся улучшить входы, выходы и управление рисками с помощью продвинутого анализа потока ордеров.
Сводка
ИИ-сводка
The Footprint Chart Indicator enhances traditional candlestick charts by displaying bid and ask volumes within each price candle. This visualization allows traders to observe buying and selling pressure at specific price levels, revealing imbalances between buyers and sellers. By providing detailed insights into order flow, market depth, liquidity, and trading activity, the indicator supports more precise trade entries, exits, and risk management decisions. It is applicable across various markets including Forex, cryptocurrencies (e.g., BTCUSD), commodities, indices, and stocks. The tool is designed for traders who utilize advanced order flow analysis to refine their strategies.
Профиль индикатора
Отзывы покупателей
4.3
Отзывы: 3
5 | 67 % | |
4 | 0 % | |
3 | 33 % | |
2 | 0 % | |
1 | 0 % |
Отзывы покупателей
September 29, 2025
This fits volume based context better as a review layer. The first forward check can be 97 setups on M1, with 20 reactions and manual notes.
September 26, 2025
More useful for someone who wants less noise in the process. The best use is checking participation and pressure, then leaving the final filter manual.
September 23, 2025
I liked it more as a confirmation layer for volume based context than as something to follow blindly. Pressure is easier to read, and the final decision still feels like it belongs to the trader. Light sizing makes the early sample easier to judge.
Обсуждение
Частые вопросы
BTCUSD
Forex
Signal
Indices
EURUSD
Commodities
GBPUSD
NZDUSD
Prop
Scalping
Crypto
Stocks
XAUUSD
NAS100
USDJPY
Продукты, доступные в cTrader Store, включая торговых ботов, индикаторы и плагины, предоставляются сторонними разработчиками и доступны исключительно в информационных и технических целях. cTrader Store не является брокером и не предоставляет инвестиционные консультации, персональные рекомендации или какие-либо гарантии будущей доходности.
Больше от этого автора


Цена
С 15/01/2025
7
Продажи