
Описание
═══════════════════════════════════════════════════════════════
EMA MTF TREND PRO — Индикатор анализа тренда на нескольких таймфреймах
Индикатор наложения для cTrader
═══════════════════════════════════════════════════════════════
Просматривайте полную картину тренда на 6 таймфреймах — в одной таблице,
на одном графике, без переключения окон.
───────────────────────────────────────────────────────────────
ЧТО ОН ДЕЛАЕТ
───────────────────────────────────────────────────────────────
EMA MTF Trend Pro объединяет направление тренда EMA, структуру канала Вайлдера,
уровни Kijun-sen, силу ADX, сигналы пересечения
и истощение импульса в единую живую панель управления.
Каждая строка в таблице — это отдельный таймфрейм. Каждый столбец
отвечает на отдельный вопрос о данном таймфрейме. Один взгляд
позволяет понять, согласованы ли таймфреймы — и безопасно ли
входить в сделку.
───────────────────────────────────────────────────────────────
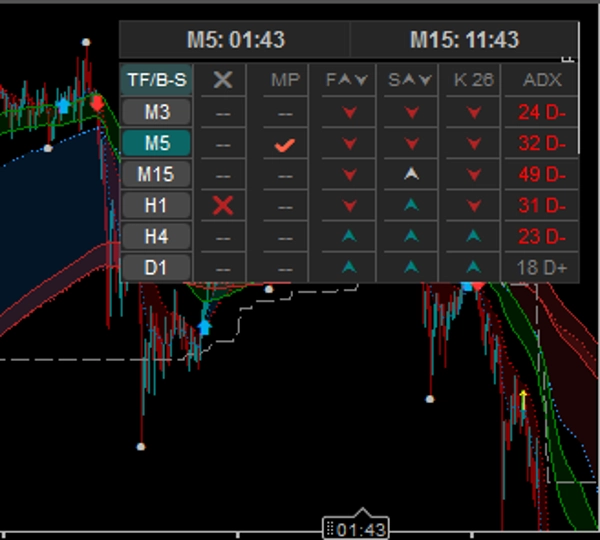
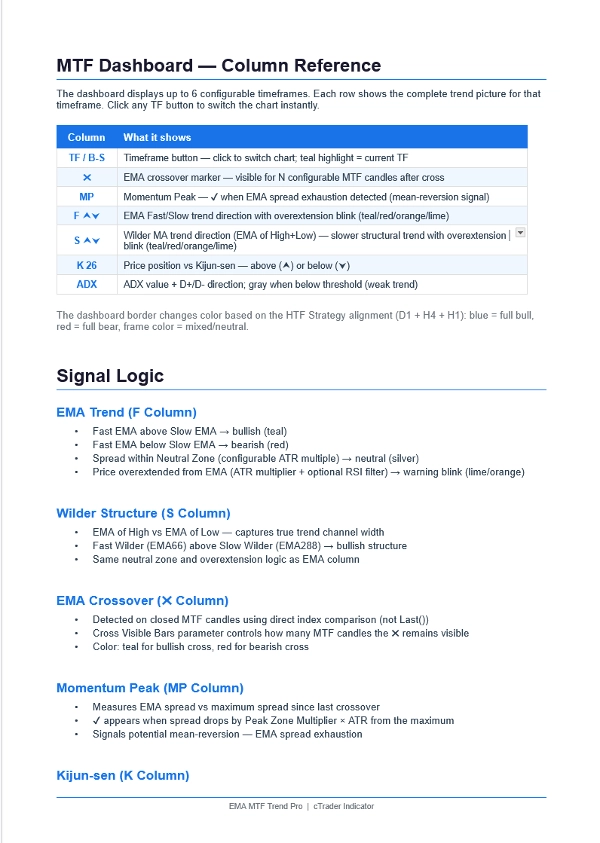
ПАНЕЛЬ УПРАВЛЕНИЯ — 6 ТАЙМФРЕЙМОВ × 7 СТОЛБЦОВ
───────────────────────────────────────────────────────────────
Столбец Что показывает
──────── ──────────────────────────────────────────────────
TF/B-S Кнопка таймфрейма — клик для мгновенного переключения графика
Бирюзовое выделение = текущий отображаемый таймфрейм
✖ Пересечение EMA — видно для N настраиваемых свечей
Бирюзовый = бычье пересечение | Красный = медвежье пересечение
MP Пик импульса — ✔ когда спред EMA исчерпан
Предупреждающий сигнал о возврате к среднему
F ⮝⮟ Направление тренда EMA Быстрой против Медленной
Бирюзовый = вверх | Красный = вниз | Серебристый = нейтрально
Мигает, когда цена слишком удалена от EMA
S ⮝⮟ Структура MA Вайлдера (EMA от High/Low)
Более медленный, более структурный фильтр тренда
K 26 Цена против Kijun-sen
⮝ = цена выше (поддержка) | ⮟ = ниже (сопротивление)
ADX Сила тренда + направление D+/D-
Серый = слабый/флэтовый рынок (ниже порога)
───────────────────────────────────────────────────────────────
ОСОБЕННОСТИ
───────────────────────────────────────────────────────────────
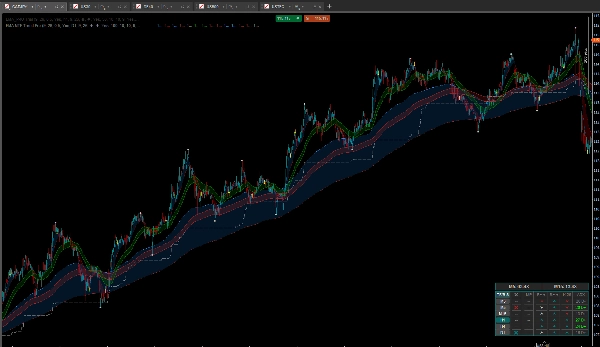
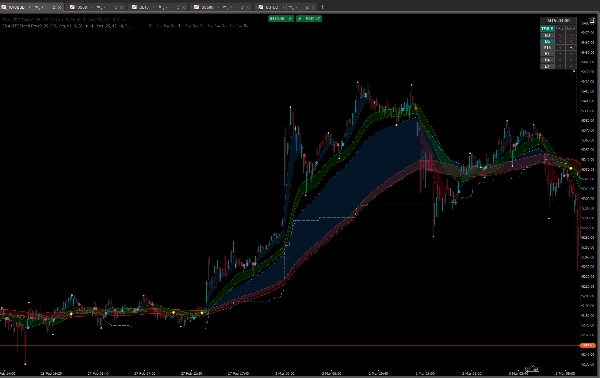
СИСТЕМА EMA CLOUD
• Быстрая + Медленная EMA с цветным заполнением облака
• Обнаружение нейтральной зоны (настраиваемый множитель ATR)
• Оповещения о чрезмерном удалении с фильтром RSI
НАЛОЖЕНИЕ MTF EMA
• Проецируйте EMA более высокого таймфрейма на текущий график
• Линейная интерполяция — плавные линии, без ступенек
• Стрелки пересечения с настраиваемыми символами и цветами
• Автоматическое скрытие стрелок наложения при выборе более высокого TF
в панели управления (предотвращает визуальный беспорядок)
ВЕРХНИЕ И НИЖНИЕ ТОЧКИ КОЛЕБАНИЙ
• Чередующиеся точки SH / SL — без повторяющихся подряд максимумов
• Опциональные текстовые метки SH / SL с позиционированием на основе ATR
• Настраиваемый размер точек, размер меток, цвета
• Единый переключатель включения/выключения для всего отображения колебаний
KIJUN-SEN
• Стандартное определение Хосоды (совпадает с TradingView / MT4)
• Настраиваемый период
• Также доступна как линия наложения MTF на графике
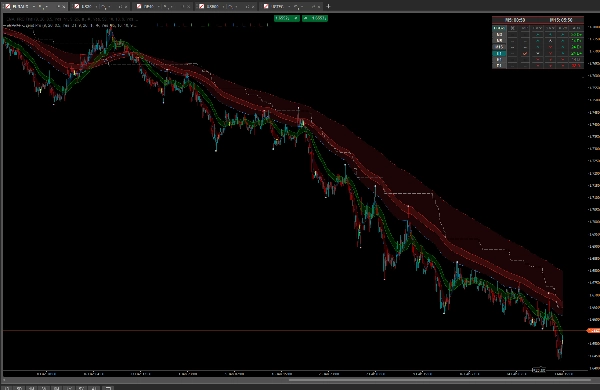
ПОЛОСЫ MA-WILDER
• EMA от High и EMA от Low — создают трендовый канал
• Быстрая полоса (EMA66) + Медленная полоса (EMA288)
• Доступны на графике и как наложение MTF
ГРАНИЦА СТРАТЕГИИ HTF
• Граница панели управления становится бирюзовой, когда D1 + H4 + H1
все бычьи (EMA + Вайлдер совпадают)
• Становится красной, когда все три медвежьи
• Мгновенное визуальное подтверждение полного согласования нескольких TF
ОБРАТНЫЙ ОТСЧЕТ СВЕЧИ
• Двойные таймеры — любые два таймфрейма
• Второй таймер может следовать за текущим TF графика
• Компактный макет в режиме одного столбца
КОМПАКТНЫЙ / ПОЛНЫЙ РЕЖИМ
• Клик по заголовку TF/B-S для переключения
• Полный режим: 7 столбцов (все сигналы)
• Компактный режим: 3 столбца (TF, EMA, Вайлдер) — минимальное пространство
───────────────────────────────────────────────────────────────
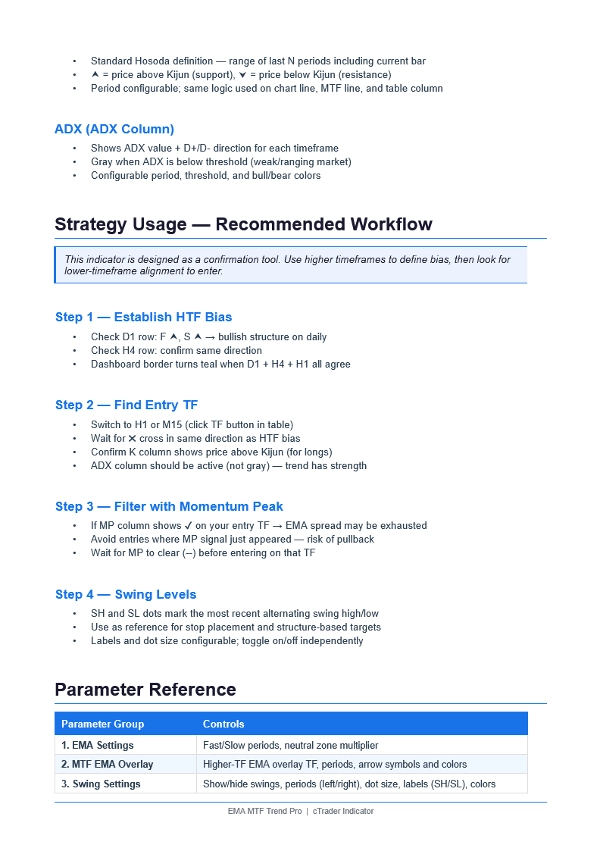
СТРАТЕГИЯ — КАК ИСПОЛЬЗОВАТЬ
───────────────────────────────────────────────────────────────
ШАГ 1 — ОПРЕДЕЛИТЕ НАПРАВЛЕНИЕ (Более высокие таймфреймы)
• Строка D1: F ⮝ + S ⮝ = бычья дневная структура
• Строка H4: то же направление = тренд подтвержден
• Граница панели управления становится бирюзовой = D1 + H4 + H1 все согласны
ШАГ 2 — НАЙДИТЕ ВХОД (Нижний таймфрейм)
• Кликните H1 или M15 в таблице для переключения графика
• Ждите ✖ пересечения в том же направлении, что и направление HTF
• Столбец K показывает ⮝ (цена выше Kijun) для длинных позиций
• Столбец ADX активен, не серый (тренд силен)
ШАГ 3 — ФИЛЬТР С ПОМОЩЬЮ ПИКА ИМПУЛЬСА
• Столбец MP показывает ✔ → спред EMA исчерпан → избегайте входа
• Ждите, пока MP не очистится (--) перед входом
• Используйте на нижних TF, чтобы избежать входа на экстремумах EMA
ШАГ 4 — ИСПОЛЬЗУЙТЕ УРОВНИ КОЛЕБАНИЙ
• Точка SH = последний максимум колебания (сопротивление / ориентир стопа)
• Точка SL = последний минимум колебания (поддержка / ориентир цели)
• Точки чередуются — всегда один максимум, один минимум одновременно
───────────────────────────────────────────────────────────────
ГРУППЫ ПАРАМЕТРОВ
───────────────────────────────────────────────────────────────
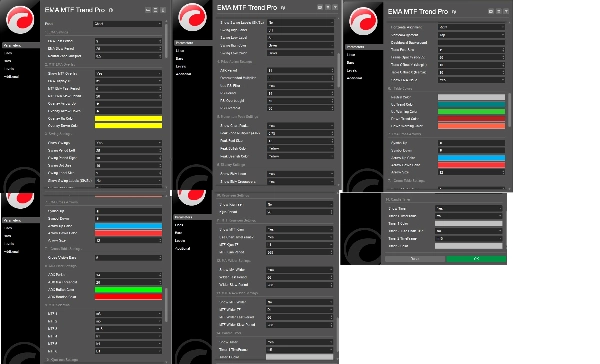
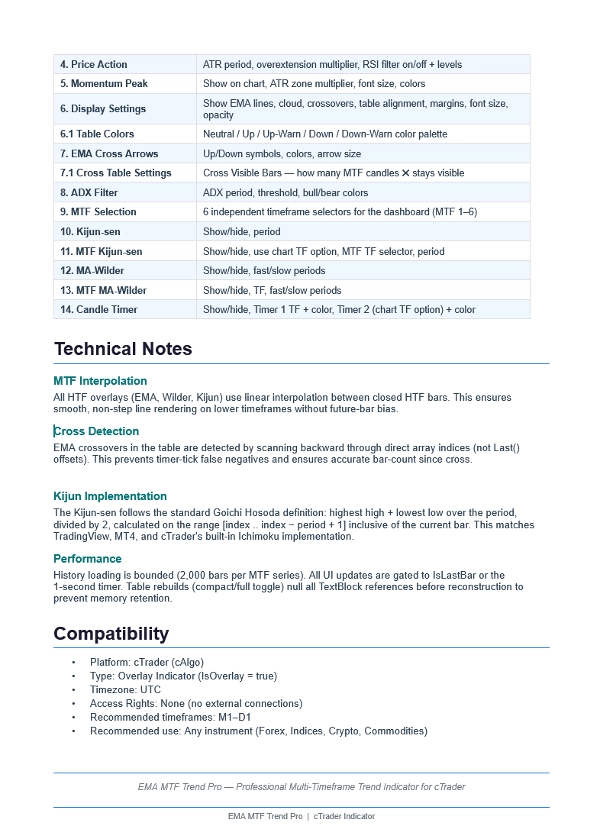
1. Настройки EMA — периоды Быстрой/Медленной, нейтральная зона
2. Наложение MTF EMA — TF, периоды, стиль стрелок
3. Настройки колебаний — показать/скрыть, периоды, метки, цвета
4. Ценовое действие — ATR, чрезмерное удаление, фильтр RSI
5. Пик импульса — множитель зоны, шрифт, цвета
6. Настройки отображения — линии, облако, макет таблицы
6.1 Цвета таблицы — полный контроль палитры
7. Стрелки пересечения EMA — символы, цвета, размер
7.1 Настройки таблицы пересечений — видимые бары пересечения (N свечей)
8. Фильтр ADX — период, порог, цвета
9. Выбор MTF — 6 × независимых селекторов TF
10. Kijun-sen — показать/скрыть, период
11. MTF Kijun-sen — TF, период, опция TF графика
12. MA-Wilder — показать/скрыть, периоды Быстрой/Медленной
13. MTF MA-Wilder — TF, периоды Быстрой/Медленной
14. Таймер свечи — TF, цвета, опция TF графика
───────────────────────────────────────────────────────────────
Сводка
Отзывы покупателей
5 | 0 % | |
4 | 100 % | |
3 | 0 % | |
2 | 0 % | |
1 | 0 % |


![Логотип продукта "Gaussian Channel [Iridio Capital]"](https://cdn.ctrader.com/image/webp/7c039209-5573-4a54-a072-f9528b503103_41960)


