
Описание
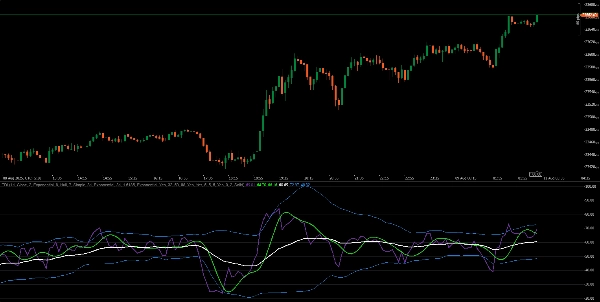
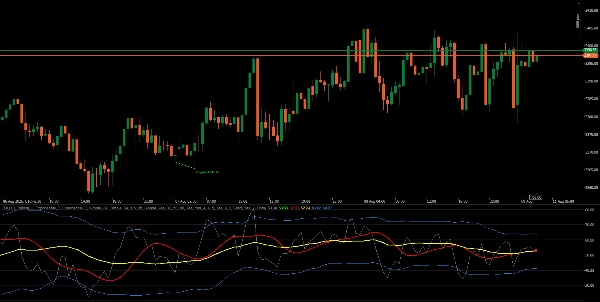
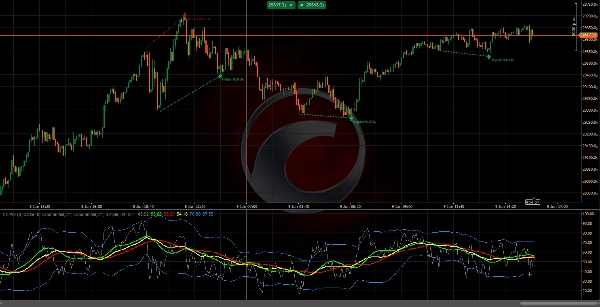
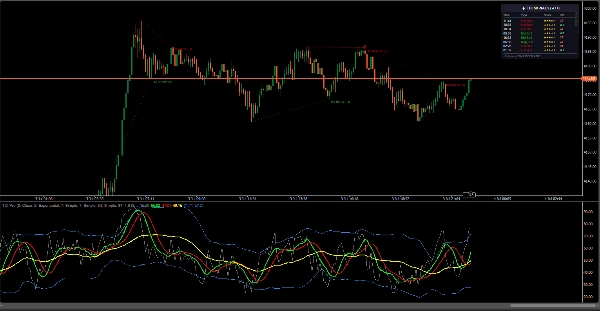
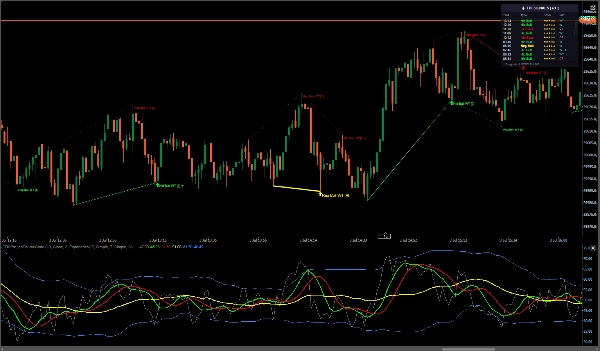
Профессиональный TDI - сочетает RSI, сглаживание скользящей средней и полосы Боллинджера с автоматическим обнаружением регулярной и скрытой дивергенции. Рисует линии дивергенции в панели TDI и (по желанию) на ценовом графике для кристально ясного контекста.
Движок дивергенции пропускает текущие бары и подтверждает повороты только после полной валидации. Фильтрация состояния рынка подавляет сигналы низкого качества в условиях флэта, в то время как оценка силы ранжирует каждую установку, используя несколько факторов совпадения, включая экстремумы полос Боллинджера, выравнивание тренда, наклон базовой линии рынка, качество поворотов и близость пересечения TDI.
- Полный набор TDI: Линия цены (зелёная), сигнальная линия (красная), базовая линия рынка (жёлтая), полосы RSI.
- Полосы волатильности: Полосы Боллинджера, применённые к RSI (период и отклонения настраиваемые).
- Движок дивергенции: Обнаруживает регулярные (разворотные) и скрытые (продолжение тренда) дивергенции.
- Визуализация на графике: Переключатель для рисования линий/меток дивергенции непосредственно на ценовом графике.
- Точные повороты: Пользовательские свинговые повороты (бары слева/справа) + минимальный интервал между барами.
Ключевые особенности
- Архитектура без перерисовки
- Фильтр состояния рынка
- Совпадение полос Боллинджера ★
- Оценка силы (1–5)
- Приоритет визуальных сигналов
- Выравнивание тренда (WT / CT)
Журнал изменений
- v1.0 – Первоначальный релиз: полный TDI + обнаружение регулярной/скрытой дивергенции, рисование на графике, уровни-гиды, расширенные настройки стиля.
Мои другие продукты
- Institutional FVG Zones MTF with Confluence
- All-in-One Session Levels Suite
- MARKET_STRUCTURE BOS_CHoCH
- Multi_TF Candlestick Chart Overlay
- ICT Killzones & Macros
- ICT_SMC_ToolKit
- VWAP_MTF
- Traders Dynamic Index (TDI)
- Market_Session_Forex
Отказ от ответственности: Торговля связана с риском, и прошлые результаты не гарантируют будущую прибыль. Используйте правильное управление рисками, соблюдайте уровни стоп-лосс и торгуйте ответственно. Я не несу ответственности за любые финансовые потери, возникшие при использовании этих алгоритмов. Используйте эти индикаторы для подтверждения и уменьшения времени разметки вашего графика.
Сводка
The indicator employs a no-repaint architecture and validates swing pivots only after full confirmation, skipping live bars to ensure signal reliability. It includes a Market State Filter to suppress low-quality signals during ranging markets and a Strength Scoring system (1–5) that ranks setups based on multiple confluence factors such as Bollinger Band extremes, trend alignment, Market Base Line slope, pivot quality, and proximity of TDI crosses.
Key components of the full TDI suite include the Price Line (green), Signal Line (red), Market Base Line (yellow), and RSI bands. Users can control precision pivots with adjustable swing pivot parameters and minimum bar spacing. Visual signal priority and trend alignment features support clearer interpretation of market conditions. The indicator supports multiple symbols including BTCUSD, EURUSD, and GBPUSD, and is designed for use with bar and tick data.
Отзывы покупателей
5 | 67 % | |
4 | 0 % | |
3 | 33 % | |
2 | 0 % | |
1 | 0 % |


![Логотип продукта "[Stellar Strategies] Inside Bar with Signals"](https://cdn.ctrader.com/image/webp/1d9e8bfa-3b2c-4440-bb37-5856902008a7_30683)


