
Описание
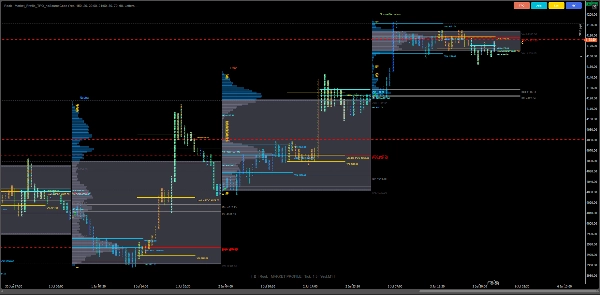
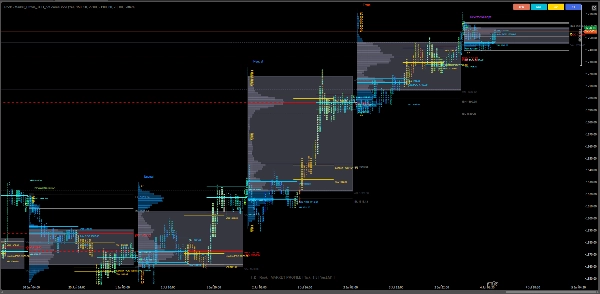
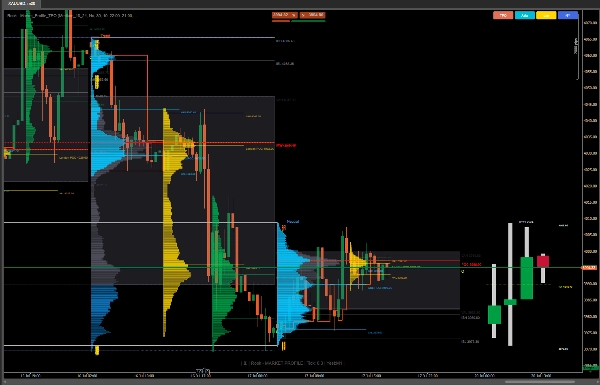
Market Profile TPO (Time Price Opportunity) приносит визуализацию структуры рынка институционального уровня в cTrader — позволяя трейдерам видеть, как цена, время и объем взаимодействуют в разных сессиях в одном интеллектуальном представлении.
Разработанный для профессиональных дневных трейдеров, аналитиков аукционного рынка и энтузиастов потока ордеров, этот индикатор предоставляет реальное отображение рыночной активности с использованием букв TPO, блоков и гистограмм. Он помогает точно определить зоны ценности, зоны POC, диапазоны начального баланса и голые уровни.
⚙️ Основные функции
✅ Визуализация (TPO)
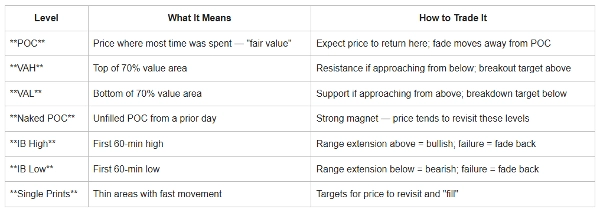
✅ Зоны POC и ценности
✅ Развивающийся POC
✅ Обнаружение начального баланса (IB)
✅ Интеллект сессий и часовых поясов
✅ Режимы отображения TPO (Буквы / Гистограмма)
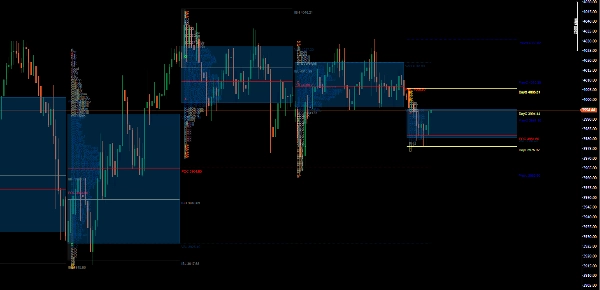
✅ Маркеры открытия/закрытия цены (O/X)
✅ Одинарные отпечатки и голые уровни POC/VA
✅ Наложение OHLC текущего и предыдущего дня
✅ Наложение OHLC текущего и предыдущего дня
✅ Проекция баров HTF (AMD)
Основные улучшения
✔ Быстрая загрузка
✔ Улучшенное управление памятью
✔ Точный расчет зоны ценности
✔ Корректное позиционирование профиля сессии
✔ Улучшенная производительность переключения
✔ Кроссплатформенная совместимость
✔ Сессии на основе UTC (без автоматического перехода на летнее время)
✔ Улучшенная обработка голого POC
✔ Улучшенный рендеринг профиля
🧭 Примеры использования в торговле
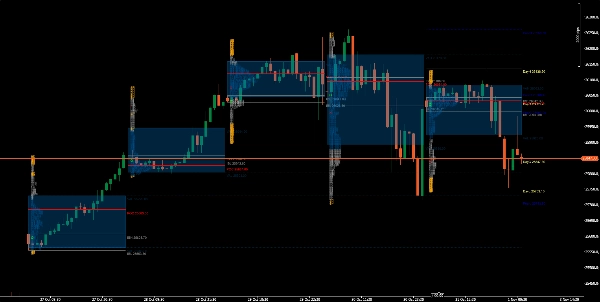
🔹 Внутридневной аукционный анализ — Определяйте, где формируется, мигрирует или прорывается ценность.
🔹 Сделки на возврат к POC и зоне ценности — Целевые ретесты равновесия или ослабление экстремумов.
🔹 Прорывы начального баланса — Определяйте, когда сессия расширяется за пределы первого часового диапазона.
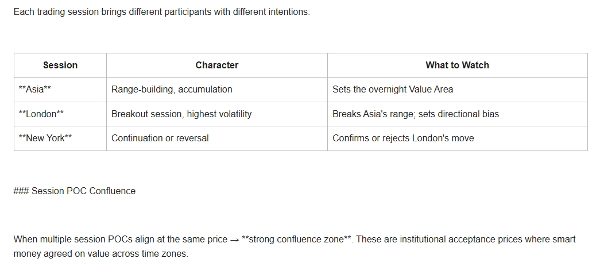
🔹 Изучение ротации сессий — Сравнивайте профили сессий Азии, Лондона и Нью-Йорка с учетом часовых поясов.
🔹 Построение институционального контекста — Совмещайте с инструментами объема или дельты для подтверждения следов умных денег.
Типы профилей
Тип Условие рынка
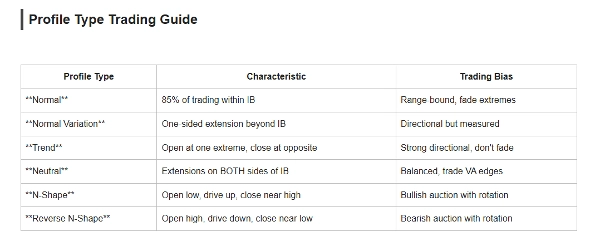
Нормальный Сбалансированный рынок
Нормальная вариация Умеренный тренд
Тренд Сильный направленный день
Нейтральный Двусторонний аукцион
N-образный бычий аукцион
Обратный N-образный медвежий аукцион
Идеально подходит для
- Теория аукционного рынка (AMT)
- Трейдеры Market Profile
- Внутридневные трейдеры
- Свинг-трейдеры
- Трейдеры фьючерсов
- Трейдеры Forex
- Профессиональный анализ потока ордеров
Принесите институциональную ясность на свои графики.
Индикатор Market Profile TPO превращает необработанные данные цены в историю ценности, дисбаланса и возможностей
Отказ от ответственности: Этот индикатор предоставляется только в образовательных и информационных целях и не является финансовой, инвестиционной или торговой рекомендацией. Market Profile — это аналитический инструмент и не гарантирует прибыли или будущих результатов.
Торговля на финансовых рынках связана с существенным риском, и прошлые результаты не гарантируют будущих. Пользователи несут полную ответственность за свои торговые решения, управление рисками и любые полученные прибыли или убытки.
Всегда проводите собственный анализ и консультируйтесь с квалифицированным финансовым специалистом перед принятием инвестиционных или торговых решений.
Сводка
Key features include multiple TPO display modes (letters and histogram), session and timezone intelligence with UTC-based sessions, open/close price markers (O/X), single prints, naked POC/VA levels, and overlays of day and previous day OHLC data. The indicator supports analysis of various market conditions through profile types like Normal (balanced market), Normal Variation (moderate trend), Trend (strong directional day), Neutral (two-sided auction), N-Shape (bullish auction), and Reverse N-Shape (bearish auction).
It is suitable for professional day traders, auction market analysts, order flow enthusiasts, and traders across Forex, indices, and commodities markets. Typical use cases include intraday auction analysis, POC and value reversion trades, initial balance breakouts, session rotation studies, and institutional context building when combined with volume or delta tools.
This indicator provides a detailed, structured view of market dynamics to support informed trading decisions based on Auction Market Theory and Market Profile principles.
Отзывы покупателей
5 | 0 % | |
4 | 100 % | |
3 | 0 % | |
2 | 0 % | |
1 | 0 % |


![Логотип продукта "[Stellar Strategies] Market Session Ultimate"](https://cdn.ctrader.com/image/webp/61ffd537-0125-4246-9e72-42eca1791d64_28232)


![Логотип продукта "Smart Money Concepts (SMC) [Iridio Capital]"](https://cdn.ctrader.com/image/webp/28b69fd1-ef54-4bed-9487-07e78e883be4_40934)

