
Описание
🚀 ICT Order Block Advanced - Профессиональный торговый индикатор
Освойте концепции ICT с самой полной системой Order Block
ICT Order Block Advanced — это идеальный инструмент для трейдеров, следующих методологии ICT (Inner Circle Trader). Это не просто индикатор order block — это полноценная институциональная торговая система, которая определяет Order Blocks, Fair Value Gaps, зоны ликвидности, Breaker Blocks и структуру рынка в одном мощном пакете.
💎 Почему это самый продвинутый индикатор Order Block
Этот индикатор объединяет ПЯТЬ ключевых концепций ICT в одну бесшовную систему:
✅ Order Blocks (OBs) — места размещения заказов институциональными игроками
✅ Fair Value Gaps (FVGs) — дисбалансы, которые институты должны заполнить
✅ Зоны ликвидности — места накопления стопов (цели для смахивания)
✅ Breaker Blocks — неудавшиеся OB, которые становятся зонами разворота
✅ Структура рынка — идентификация HH, HL, LH, LL с BOS/CHoCH
Это методология ICT в самой чистой и практичной форме.
✨ Ключевые особенности, которые выделяют этот индикатор
🎯 Умное обнаружение Order Block
- Автоматически определяет институциональные order blocks
- Показывает последние 6 блоков (настраивается от 1 до 15)
- Цветовая кодировка по направлению (Зеленый = бычий, Красный = медвежий)
- Автоматическое удаление при устранении
📊 Система оценки качества (от A+ до C)
- Оценивает каждый Order Block по качеству (A+, A, B, C)
- Учитывает объем, размер, структуру и конвергенцию
- Более высокая оценка = более вероятная сделка
- Визуальная прозрачность мгновенно показывает качество
🎨 Обнаружение Fair Value Gaps (FVG)
- Определяет бычьи и медвежьи дисбалансы
- Настраиваемые цвета (зеленые/красные зоны)
- Автоматическое удаление при заполнении
- Показывает, куда цена, вероятно, вернется
💰 Картирование зон ликвидности
- Отмечает последние максимумы/минимумы (пулы ликвидности)
- Показывает, где институты смахнут стопы
- Толщина линии = сила ликвидности
- Идеально для сделок по захвату ликвидности
🔄 Идентификация Breaker Block
- Обнаруживает, когда Order Blocks не срабатывают и меняют направление
- Бывшая поддержка становится сопротивлением (и наоборот)
- Показывает институциональные ловушки
- Секретное оружие продвинутых трейдеров
📈 Полная структура рынка
- Отмечает HH (Higher High), HL (Higher Low)
- Отмечает LH (Lower High), LL (Lower Low)
- Автоматически рисует трендовые линии
- Определяет BOS (Break of Structure) и CHoCH (Change of Character)
⚡ Фильтр волатильности
- Опциональный фильтр на основе ATR
- Показывает OB только при высокой волатильности
- Отфильтровывает слабые/низкокачественные блоки
- Фокус на институциональных сетапах
🎯 Как профессиональные трейдеры ICT используют этот индикатор
Стратегия 1: Вход в Order Block высокого качества
Настройка: рынок создает Order Block, индикатор оценивает его как "A+" или "A"
Сделка:
- Ждите, пока цена вернется в зону OB
- Входите, когда цена касается OB (отображается зеленым/красным прямоугольником)
- Стоп-лосс: за пределами OB
- Цель: следующая зона ликвидности или противоположный OB
Почему это работает: блоки с оценкой A+ имеют наибольший институциональный интерес — объем, структура и конвергенция совпадают. Это блоки, которые институты будут защищать.
Стратегия 2: Конвергенция Fair Value Gap + Order Block
Идеальная настройка:
- Формируется Order Block (зеленый прямоугольник)
- Появляется Fair Value Gap на том же уровне (светло-зеленая зона)
- Цена откатывается к этой зоне конвергенции
Вход: входите в LONG, когда обе зоны совпадают. Двойной институциональный интерес = двойная вероятность.
Почему это мощно: институты оставили ДВА типа неэффективностей на одной цене — они ОБЯЗАТЕЛЬНО вернутся сюда.
Стратегия 3: Смахивание ликвидности в Order Block
Классика ICT:
- Определите зону ликвидности (пунктирная линия на недавнем минимуме)
- Цена смахивает ниже нее (забирает розничные стопы)
- Цена сразу разворачивается в бычий Order Block
- ВХОД В LONG — институты только что захватили ликвидность и теперь покупают
Почему это золото: именно так работают институты: смахивают ликвидность (стопы розничных трейдеров), затем толкают цену в обратную сторону. Вы ловите разворот.
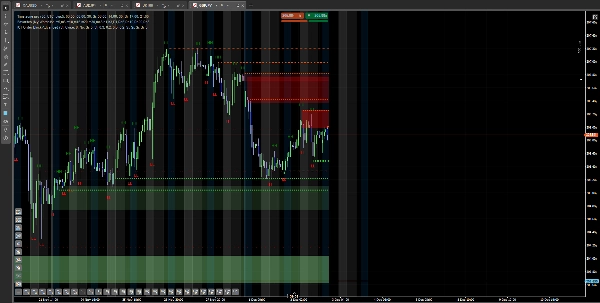
Стратегия 4: Разворот Breaker Block
Настройка:
- Бычий Order Block был устранен (пробит)
- Индикатор показывает его как Breaker Block (темная зеленая пунктирная линия)
- Цена возвращается, чтобы протестировать его сверху
Сделка: входите в SHORT, когда цена касается Breaker Block сверху. То, что было поддержкой, теперь сопротивление.
Почему это работает: институты не смогли удержать этот уровень — теперь они защищают его с противоположной стороны.
Стратегия 5: Подтверждение структуры рынка
Использование HH, HL, LH, LL:
- Рынок показывает HL (Higher Low) + HH (Higher High) = бычья структура
- Order Block формируется на HL
- Только лонговый уклон — структура подтверждает направление
BOS против CHoCH:
- BOS (Break of Structure) = продолжение тренда
- CHoCH (Change of Character) = разворот тренда
- Торгуйте только OB, соответствующими текущей структуре
🔥 Чем этот индикатор отличается от базовых индикаторов Order Block
Базовые индикаторы OB показывают только order blocks, без оценки качества, без Fair Value Gaps, без зон ликвидности, без breaker blocks, без структуры рынка и рассматривают все OB одинаково.
ICT Order Block Advanced показывает полную систему ICT (5 концепций), оценивает качество OB (от A+ до C), автоматически определяет Fair Value Gaps, отображает зоны ликвидности, обнаруживает breaker blocks, отмечает полную структуру рынка (HH/HL/LH/LL), имеет фильтр волатильности и показывает зоны конвергенции.
Это разница между инструментом и полноценной торговой системой.
🎓 Кому нужен этот индикатор?
✅ Студенты ICT — учитесь и правильно применяйте концепции ICT
✅ Трейдеры Order Block — получайте OB с оценкой качества и конвергенцией
✅ Трейдеры Smart Money — видьте все институциональные следы
✅ Трейдеры ликвидности — определяйте возможности для смахивания
✅ Трейдеры структуры — автоматическое обозначение HH/HL/LH/LL
✅ Серьезные трейдеры — полная система, а не только одна концепция
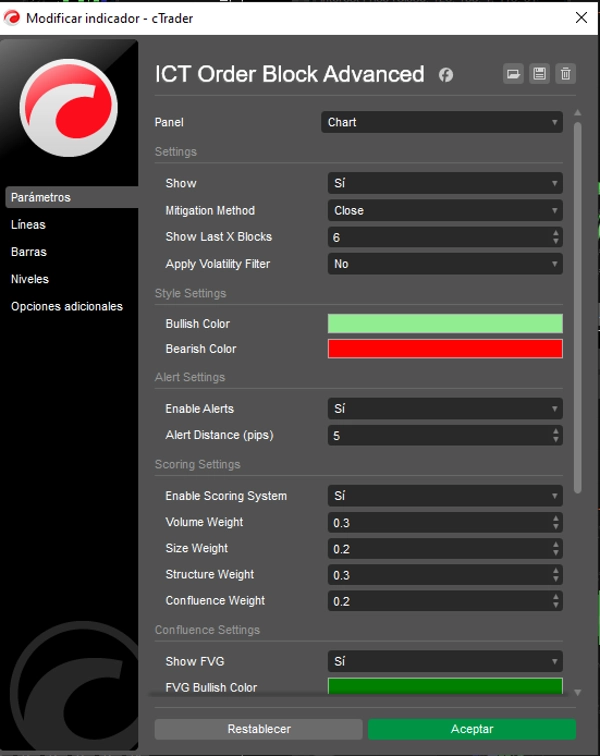
⚙️ Полностью настраиваемый
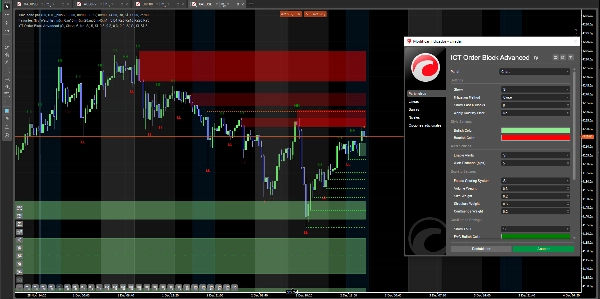
Настройки Order Block:
- Показывать последние X блоков (1-15, по умолчанию 6)
- Метод устранения (Close или Wick)
- Фильтр волатильности вкл/выкл
- Настраиваемые цвета (бычий/медвежий)
Система оценки качества:
- Включение/отключение оценки
- Настройка весов: объем, размер, структура, конвергенция
- Настраиваемая прозрачность по качеству
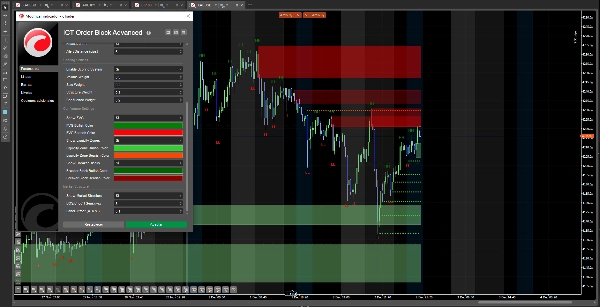
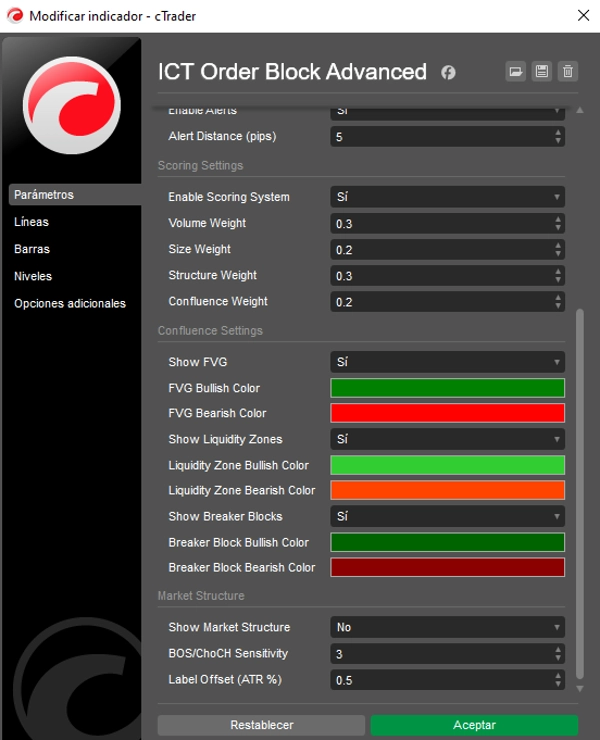
Особенности конвергенции:
- Показать/скрыть Fair Value Gaps (настраиваемые цвета)
- Показать/скрыть зоны ликвидности (настраиваемые цвета)
- Показать/скрыть Breaker Blocks (настраиваемые цвета)
Структура рынка:
- Показать/скрыть маркеры HH/HL/LH/LL
- Чувствительность BOS/CHoCH (1-10)
- Настройка смещения меток
- Автоматическое рисование трендовых линий
🛡️ Встроенное управление рисками
Размещение стоп-лосса:
- Прямо за границей Order Block
- Ниже/выше Breaker Block
- Вне Fair Value Gap
Подтверждение входа:
- Ждите блоки с оценкой A или A+
- Ищите конвергенцию (OB + FVG + ликвидность)
- Подтверждайте структурой рынка (HH/HL для лонгов)
Размер позиции:
- Больше на блоках A+ с конвергенцией
- Средний на блоках с оценкой A
- Меньше на блоках B/C или одиночных сетапах
Цели по прибыли:
- Следующая зона ликвидности
- Противоположный Order Block
- Fair Value Gap с другой стороны
- Уровни структуры рынка (HH/LL)
🚀 Полная система ICT, которая вам нужна
Этот индикатор отвечает на все вопросы трейдера ICT:
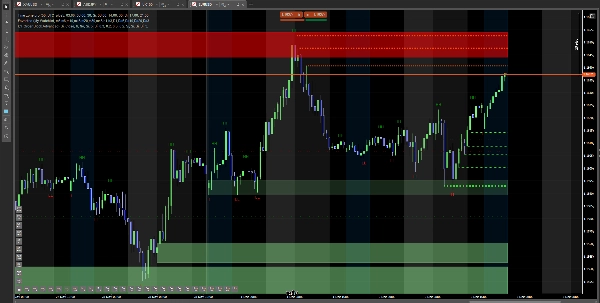
✅ Где находятся Order Blocks? (зеленые/красные прямоугольники с оценками)
✅ Какие OB самые качественные? (оценки A+, A, B, C)
✅ Где Fair Value Gaps? (светло-зеленые/красные зоны)
✅ Где ликвидность? (пунктирные линии на максимумах/минимумах)
✅ Активны ли Breaker Blocks? (темные пунктирные линии)
✅ Какая структура рынка? (маркировка HH, HL, LH, LL)
✅ Это BOS или CHoCH? (трендовые линии показывают пробои структуры)
Перестаньте собирать множество индикаторов по кусочкам. Получите полную систему ICT.
📈 Работает на всех рынках и таймфреймах
- Форекс — все пары (основной рынок ICT)
- Индексы — NAS100, US30, UK100, SPX500, GER40
- Товары — золото, серебро, нефть
- Криптовалюты — биткойн, эфир
- Таймфреймы — от 1 минуты до дневного (5мин-1ч оптимально для ICT)
Примечание: концепции ICT лучше всего работают на ликвидных рынках с институциональным участием.
🎁 Освойте торговлю ICT сегодня
Перестаньте бороться с частичными системами. Получите полную методологию ICT в одном индикаторе.
Видьте Order Blocks. Оценивайте качество. Находите конвергенцию. Торгуйте структуру. Следите за ликвидностью.
Совместимо с cTrader. Одноразовая покупка, пожизненные обновления.
Сводка
Key features include automatic detection and color-coded display of recent order blocks with a quality grading system (A+ to C) based on volume, size, structure, and confluence. It identifies bullish and bearish Fair Value Gaps and liquidity pools, maps breaker blocks for reversal zones, and marks market structure with trend lines. An optional ATR-based volatility filter highlights high-probability setups.
The indicator supports multiple markets including Forex, indices, commodities, cryptocurrencies, and stocks, and works across timeframes from 1 minute to daily (optimal 5 minutes to 1 hour). It offers customizable settings for block display, scoring weights, colors, and structure sensitivity.
ICT Order Block Advanced also provides built-in risk management guidance with stop loss placement beyond order blocks or breaker blocks, entry confirmation through confluence and market structure, and position sizing recommendations based on block quality. This tool consolidates ICT concepts into a unified system for institutional-level market analysis.


