
Описание
SMARTRSI CLOUD SYSTEM - Продвинутый инструмент анализа импульса
Преобразуйте свой анализ RSI с помощью этого революционного индикатора, который сочетает технологию сглаживания Heikin Ashi с RSI, центрированным вокруг нуля, для кристально чистых сигналов импульса. В отличие от традиционных индикаторов RSI, которые могут быть шумными и трудными для интерпретации, SmartRSI Cloud System фильтрует рыночный шум и выделяет истинный направленный импульс.
КЛЮЧЕВЫЕ ОСОБЕННОСТИ:
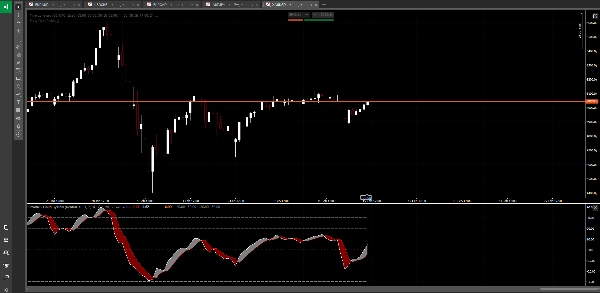
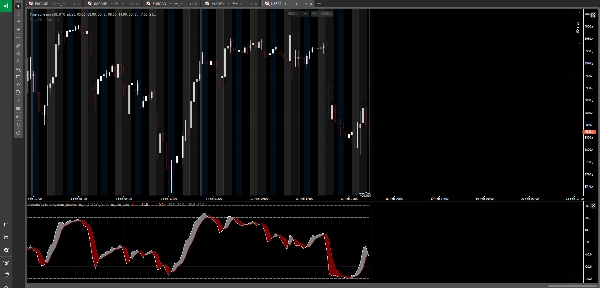
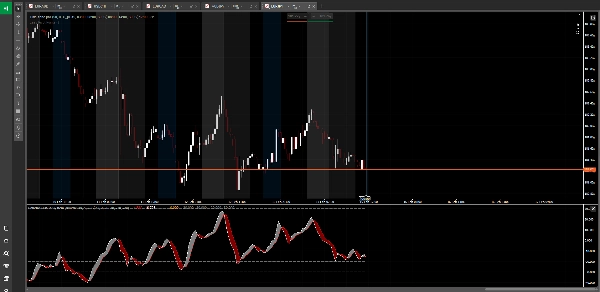
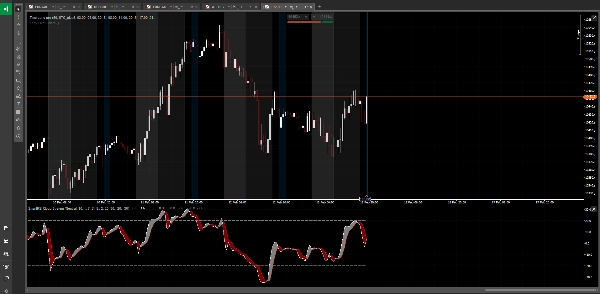
☁️ Облако Heikin Ashi RSI
Испытайте сглаженный анализ импульса с визуальными облачными формированиями. Облако мгновенно показывает силу и направление рыночного импульса, делая идентификацию тренда простой.
⚖️ RSI, центрированный вокруг нуля
Видьте импульс таким, какой он есть — центрированным вокруг нуля для ясного бычьего/медвежьего смещения. Положительные значения указывают на силу покупателей, отрицательные — на давление продавцов. Больше не нужно гадать, растет RSI или падает.
🎯 Умная технология сглаживания
Исключите ложные сигналы с помощью интеллектуального сглаживания RSI. Индикатор применяет принципы Heikin Ashi к расчетам RSI, значительно уменьшая ложные колебания при сохранении точности сигналов.
🔄 Адаптивные режимы трейдера
Переключайтесь между тремя торговыми режимами:
• Нейтральный режим — видеть все сигналы
• Режим покупателей — фильтр только для длинных позиций
• Режим продавцов — фильтр только для коротких позиций
📊 Многоуровневые зоны перекупленности/перепроданности
Четыре различных уровня помогут вам оценить экстремумы импульса:
• Стандартные уровни OB/OS для начальных предупреждений
• Экстремальные уровни OB/OS для зон разворота
• Полностью настраиваемые под ваш стиль торговли
🎨 Профессиональная визуализация
Чистый, интуитивно понятный дисплей с:
• Облаками, окрашенными по цвету
• Опциональной линией графика RSI с настраиваемыми цветами
• Четкими граничными уровнями
• Линией нуля для мгновенного распознавания смещения
⚙️ Полная настраиваемость
Настраивайте каждый аспект:
• Длина HARSI и параметры сглаживания
• Период расчета RSI
• Уровни перекупленности/перепроданности
• Визуальные элементы и цвета
• Предпочтения режима трейдера
ИДЕАЛЬНО ДЛЯ:
• Определения сильных трендов импульса
• Обнаружения дивергенций между ценой и импульсом
• Тайминга входов в условиях перекупленности/перепроданности
• Фильтрации сделок на основе рыночного смещения
• Подтверждения пробоев и продолжения тренда
• Мультивременного анализа импульса
ЧТО ДЕЛАЕТ ЕГО УНИКАЛЬНЫМ:
Традиционные индикаторы RSI показывают сырые данные импульса, которые могут быть резкими и вводящими в заблуждение. SmartRSI Cloud System применяет институциональное сглаживание, сохраняя целостность сигнала. Подход с центром в нуле устраняет путаницу в направлении импульса, а визуализация облака делает сложные паттерны импульса мгновенно узнаваемыми.
Будь вы скальпером, дейтрейдером или свинг-трейдером, этот инструмент дает вам ясность по рыночному импульсу, которую стандартные индикаторы просто не могут обеспечить.
---
⚠️ ОТКАЗ ОТ ОТВЕТСТВЕННОСТИ ЗА РИСКИ:
Торговля на рынке форекс, криптовалютами и другими финансовыми инструментами связана с высоким уровнем риска и может не подходить всем инвесторам. Высокая степень кредитного плеча может работать как против вас, так и в вашу пользу. Прежде чем принимать решение о торговле, вы должны тщательно оценить свои инвестиционные цели, уровень опыта и склонность к риску. Существует вероятность того, что вы можете понести убытки в размере части или всей вашей инвестиции. Поэтому не следует инвестировать деньги, которые вы не можете позволить себе потерять. Вы должны быть осведомлены обо всех рисках, связанных с торговлей, и при наличии сомнений обратиться за советом к независимому финансовому консультанту. Прошлые результаты не являются гарантией будущих.
Сводка
Отзывы покупателей
5 | 100 % | |
4 | 0 % | |
3 | 0 % | |
2 | 0 % | |
1 | 0 % |


