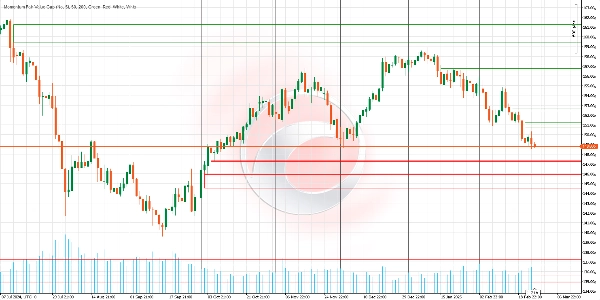
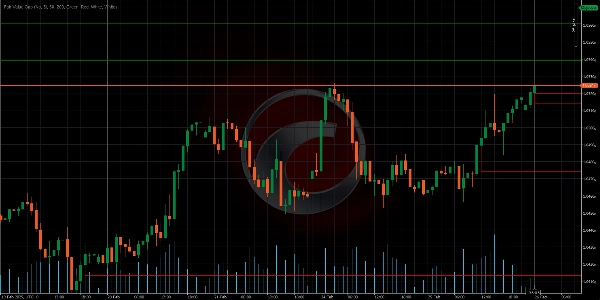
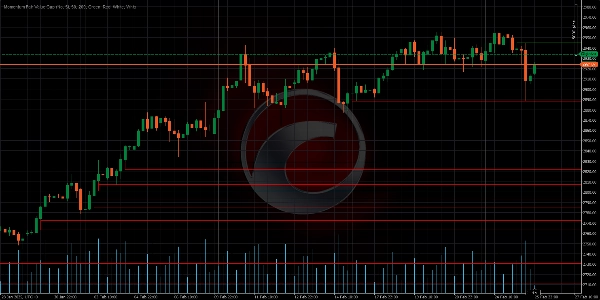
Индикатор
RSI
Breakout
Supertrend
EURUSD
Momentum Fair Value Gap
03/09/2025
1
Desktop
С 03/10/2024
Продажи
127
Бесплатные установки
24621
Загруженное изображение продукта "Momentum Fair Value Gap"Загруженное изображение продукта "Momentum Fair Value Gap"Загруженное изображение продукта "Momentum Fair Value Gap"

It identifies areas of market imbalance (Fair Value Gaps or FVGs) and projects them on the chart in a smart way. Unlike other indicators, this one adapts in real-time to price action, adjusting its size, persistence, and relevance. It's ideal for traders seeking clear targets and advanced visual gap management.

KEY FEATURES

  1. Dynamic Gap Adjustment
    Logic: If the price partially touches an FVG (e.g., grazes the lower boundary), the indicator automatically resizes the gap to reflect only the uncovered area.
    Benefit: Avoids false signals and keeps only gaps with real potential active.
  2. MidPoint Fill
    Logic: Draws a line at the center of the gap. If the price touches it, the FVG is considered "filled" and can be removed (configurable).
    Benefit: Requires only 50% contact to confirm closure, filtering noise and premature trades.
  3. Infinite Projection Until Filled
    Logic: Gaps extend into the future indefinitely (they don't disappear after X candles).
    Benefit: Provides persistent reference until the market resolves the imbalance.
  4. Automatic Cleanup of Invalidated Gaps
    Logic: Automatically removes old gaps when they are fully filled.
    Benefit: Keeps the chart clean and focused on active zones.
  5. Advanced Visual Customization
    Options: Different colors for bullish (green) and bearish (red) gaps. Transparency adjustment to avoid chart clutter.
    Benefit: Adapts to any trading style or visual strategy.

🎯 HOW TO USE IT IN TRADING?

Identification of Key Zones:

  • Bullish FVG (Green): Area where buyers temporarily lost strength.
    → Strategy: Look for buying opportunities during pullbacks to this zone.
  • Bearish FVG (Red): Area where sellers were overtaken.
    → Strategy: Look for selling opportunities during rallies to this zone.

Interaction with Price:

  • If the gap adjusts dynamically (reduces its size), it indicates that the market is testing the zone but without confirmation.
  • If the gap is removed (by full fill or MidPoint), consider the imbalance corrected.

🔍 CONFIRMATION WITH OTHER TOOLS

Combine FVGs with supports/resistances, volume, or RSI to filter signals.

📋 FEATURE COMPARISON

___________________________________________________________________________________

Feature Momentum Fair Value Gap Traditional Indicators

________________________________________________________________________________

Persistence---------------- Extends gaps until filled ----------------------- Disappear after X candles

Closure Precision-------- 50% confirmation option --------------------- Requires full gap fill

Flexibility ------------------ Resizes with price ------------------------- Static and immutable levels

Visual Focus---------------- Removes irrelevant gaps ----------------------- Clutters chart with past data


📝 PRACTICAL EXAMPLE

Scenario in EURUSD (1H):
A Bullish FVG (green) forms after a pronounced bearish candle. Days later, the price retraces, touching the lower boundary of the gap but doesn’t fill it. The indicator automatically reduces the gap size. Finally, the price touches the MidPoint (centerline), triggering its removal. The trader goes short after confirming rejection in the zone.


Ctrader Store indicators:


Channel Breakout System

Fair Value Gap Sessions

 BOS & CHOCH

ZigZag

Supertrend

Market Imbalance

Adaptive Trend Channel 

Dynamic Market Structure
Analysis of Turning Points

Order Block

Fibonacci Linear
Regression Multi-timeframe

Volume POC Heatmap

Dynamic RSI

Momentum Fair Value Gap

Market Flow Projection

Dynamic Trend Gradient

Multi-Level Candle Bias
Tracker

Zig-Zag Extremity Tracker

Reactive Moving Average

Auto-Trend Channel

Auto Support and
Resistance Trend Lines

All Support and
Resistance Levels

Leverage Liquidation Map

Zones Supply Demand

Dynamic Range Momentum

0.0
Отзывы: 0
Отзывы покупателей
У этого продукта еще нет отзывов. Уже попробовали его? Поделитесь впечатлениями!
Больше от этого автора
Высокий рейтинг
Бесплатно
Индикатор
RSI
Breakout
XAUUSD
+6
ZigZag
ZigZag filters noise, spots trends, patterns, pivots, aiding analysis, trade management, and confirmations. 📉📈
Популярный
$ 15
Индикатор
RSI
Breakout
XAUUSD
+6
Order Block
Identify bullish and bearish Order Blocks to spot key support/resistance levels and potential trend reversals! 📈🔄
Высокий рейтинг
Бесплатно
Индикатор
RSI
Breakout
XAUUSD
+5
Auto-Trend Channel
Adaptive trend channel using linear regression and Pearson correlation for dynamic support, resistance, and trends.
Популярный
$ 15
/
$25
Индикатор
RSI
XAUUSD
Breakout
+5
BOS & CHOCH
Market structural patterns , specifically the concepts of Change of Character (ChoCH) 🔄 and Break of Structure (BoS) 💥
Высокий рейтинг
Бесплатно
Индикатор
RSI
Breakout
XAUUSD
+6
Volume POC Heatmap
📊 Shows volume by price levels, highlights POC, and key zones. Identifies dynamic support/resistance and imbalances.
Индикатор
RSI
Breakout
Supertrend
All Support and Resistance Levels
"Identify key market zones and visualize support/resistance from multiple timeframes on a single chart.
Индикатор
RSI
Breakout
XAUUSD
+5
Zones Supply Demand
📊Zones Supply & Demand: Identifies key price levels with high volume concentration, marking Supply/Demand Zones & Marke
Популярный
$ 15
Индикатор
RSI
Breakout
XAUUSD
+5
Supertrend
💹 Define a price channel 📈 and determine trend direction (bullish 🟢 or bearish 🔴).
Индикатор
RSI
Breakout
XAUUSD
+6
Fair Value Gap Sessions
identify and highlight temporary market inefficiencies known as "fair value gaps" 🚨 within specific trading Sessions.
Индикатор
RSI
Breakout
XAUUSD
+4
Dynamic Market Structure Analysis of Turning Points
Identify market structure effortlessly with swing highs, lows, CHoCH, and BOS levels for smart trading decisions! 📊🔍"
Индикатор
Indices
RSI
XAUUSD
+7
RSI Divergence
Detects bullish and bearish divergences
Индикатор
RSI
Breakout
Supertrend
Trend Heikin Multi MA
🚀 TrendHeikinMultiMA: Advanced trend detection using Heikin-Ashi smoothing & MAs! Eliminates noise, confirms real trend
Индикатор
RSI
Breakout
XAUUSD
+4
Multi-Level Candle Bias Tracker
Price direction by calculating the probability of reaching new highs/lows. Shows levels & stats📈
Advanced Market Structure Bos,Choch,SwinLevels, Order Blog
Advanced price action tool that combines multiple technical analysis concepts
Высокий рейтинг
Бесплатно
Индикатор
RSI
Breakout
Supertrend
Swing Levels
🔍 Automatically detect support and resistance levels based on "swings" or pivots
Индикатор
NAS100
NZDUSD
XAUUSD
+9
PineScriptLabs Smart Signals CDRC Auto TPSL
🎯Smart Signals : Auto Buy/Sell alerts with dynamic TP/SL algorithm. 💡
Индикатор
RSI
Breakout
Supertrend
Market Trend OB
Price action to detect when the market changes trend (MSB) and defines, order blocks , ZigZag etc.📊
Индикатор
RSI
Breakout
Supertrend
Leverage Liquidation Map
📊 Liquidation Map: Potential areas where highly leveraged investors might face liquidations.
Вам также может понравиться
Индикатор
Indices
Prop
Stocks
+3
Dynamic Candle Timer v1.5 2025
Dynamic Candle Timer is a fully customizable feature-packed indicator that offers multiple count-down/up modes and...
LT Flexible Volume Profile
Flexible Volume Profile, designed with performance in mind.
EURUSD Breakout Indicator
Breakout Multi-Timeframe Strategy Indicator
Индикатор
NAS100
NZDUSD
XAUUSD
+10
[Stellar Strategies] VBO
Next-gen Volume Oscillator using Hyperbolic Tangent math. No repainting. Includes arrows, alerts, and overlay mode 🎯
Market Sessions V2_NSC
Market Session V2: Full Control. colors, history, session/text toggles, font size. Elevate your strategy!
Индикатор
NAS100
NZDUSD
Martingale
+26
Intraday MTF Candle Status
Intraday MultiTimeframe Candle Status Indicator
Индикатор
NAS100
NZDUSD
Breakout
+13
Meridian Pivot Points Pro
🚀See the market’s framework, decide faster. Session-Aware Pivots. Auto Presets. Pro-Grade Zones.🚀
Индикатор
NAS100
NZDUSD
XAUUSD
+7
Bayesian Price Projection Model
Bayesian theory** to forecast a future price while providing **uncertainty ranges** that represent upper and lower bound
TrendMagicOptimized
Clean trend indicator using CCI & ATR. Highlights up/down trends with adaptive, no-repaint lines.
Популярный
$ 20
Индикатор
NAS100
Indices
XAUUSD
+8
HIGHS LOWS AEGIS
PDL/PDH/PWL/PWH and Session higs/lows (customizable)
Индикатор
Indices
Breakout
Commodities
+3
Trend Lines Auto - FXMaster
Auto Trend Line Indicator for cTrader
Индикатор
Indices
Prop
Breakout
+3
RVI
A precision-crafted indicator that compares current volume to its historical average for the same time of day.
Индикатор
NAS100
NZDUSD
Breakout
+11
Previous day Key Levels
Previous day key levels indicator
Moving Average Plus
10 configurable moving averages: choose type, period, color per line; single price source for all.
Индикатор
RSI
Breakout
XAUUSD
+12
Stop Loss Professional
Stop Loss Pro – Precision Risk Management for Every Trader
Индикатор
RSI
Breakout
Supertrend
+3
Fibonacci Linear Regression Multi-timeframe
Combining Fibonacci levels and regression to analyze multidimensional market trends across multiple timeframes¡
Высокий рейтинг
Бесплатно
Market Session BT
Market Session BT
Индикатор
RSI
Breakout
XAUUSD
+6
Fair Value Gap Sessions
identify and highlight temporary market inefficiencies known as "fair value gaps" 🚨 within specific trading Sessions.