Description
Indicateurs Pinescriptlabs Store : Pinescriptlabs Store cBots : (cBot) Gold & BTC BreakoutSession Pivots(nouveau)
Carte de Liquidation à Effet de Levier
Prédiction Basée sur Linreg & ATR
SmartTrend Support &
Resistance
Lines
Analyse
Dynamique de la Structure
du Marché
des
Points
de Renversement
Régression
Linéraire
Fibonacci
Multi-échelle
Gradient de Tendance Dynamique
Suivi
du Biais
Multi-niveaux de Chandeliers
Support
et Résistance
Automatiques
de Tendance
Lignes
Tous
les Supports et
Résistances
Niveaux
Momentum de la Plage Dynamique
Le RSI Divergence est un outil d'analyse technique avancé conçu pour détecter les divergences entre le prix et l'indice de force relative (RSI) . Ces divergences sont des signaux puissants qui peuvent anticiper des changements de direction du marché, en faisant une ressource précieuse pour les traders techniques. 🔍💡
⚙️ Comment ça fonctionne ?
Cet indicateur fonctionne sur le principe que le prix et le RSI ne bougent pas toujours en synchronisation. Lorsqu'une divergence se produit, cela signifie que le prix envoie un signal contraire à la tendance sous-jacente du RSI. Cela peut être un avertissement précoce que la tendance actuelle pourrait perdre de sa force.
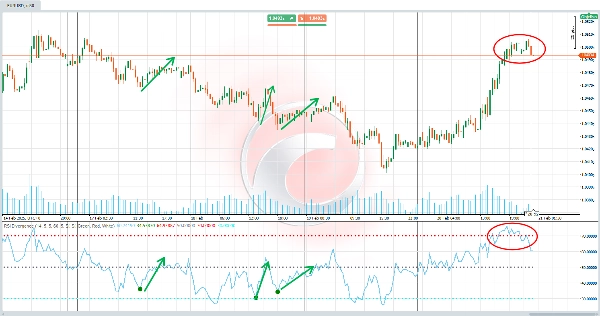
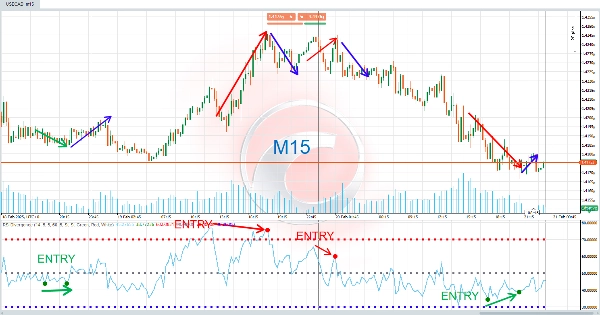
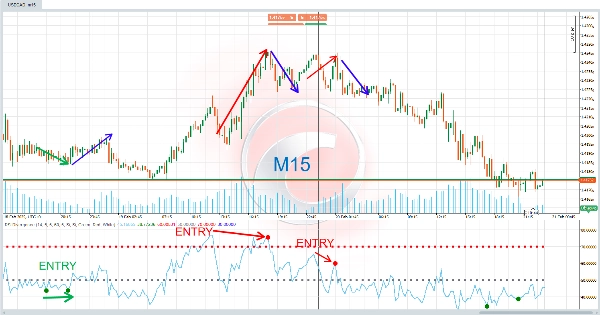
- Divergence haussière (tendance à la hausse) 📈 :
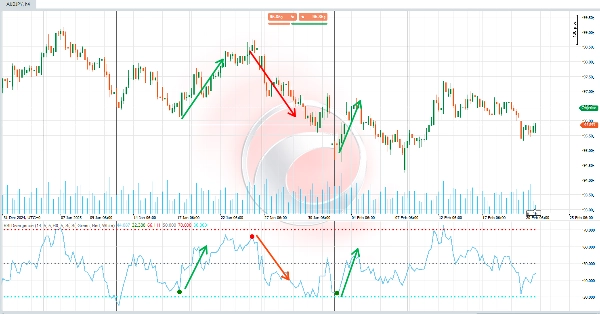
Se produit lorsque le prix forme des creux plus bas , mais que le RSI forme des creux plus hauts . Cela suggère que, bien que le prix baisse, l'élan haussier pourrait gagner du terrain, ce qui pourrait conduire à un renversement à la hausse. ✅ - Divergence baissière (tendance à la baisse) 📉 :
Se produit lorsque le prix forme des sommets plus hauts , mais que le RSI forme des sommets plus bas . Cela suggère que, bien que le prix augmente, l'élan baissier pourrait gagner du terrain, ce qui pourrait conduire à un renversement à la baisse. ❌
L'indicateur détecte automatiquement ces divergences et les met en évidence sur le graphique avec des couleurs, des lignes et des étiquettes pour une interprétation facile. 🎯
💡 À quoi ça sert ?
Cet indicateur est particulièrement utile pour :
- Identifier les points d'entrée et de sortie : Les divergences peuvent agir comme des signaux d'achat (haussiers) ou de vente (baissiers). 🛒💸
- Anticiper les changements de tendance : Les divergences sont des signaux précoces que la tendance actuelle pourrait perdre de sa force. ⚡
- Confirmer l'analyse technique : Il peut être utilisé avec d'autres indicateurs ou modèles de chandeliers pour valider les décisions de trading. 🧠📊
Il est idéal pour les traders intraday comme pour les investisseurs à long terme, car les divergences s'appliquent à n'importe quelle période. ⏳📈
🛠️ Comment l'utiliser ?
- Configuration initiale :
-
- Personnalisez les paramètres selon vos besoins, tels que la période du RSI, les plages de recherche de pivots et les couleurs des signaux. 🎨⚙️
- Activez ou désactivez l'affichage des divergences haussières ou baissières selon vos préférences. ✅❌
- Interprétation des signaux :
-
- Divergence haussière : Lorsqu'un signal "D" vert apparaît sur le graphique, cela indique une possible opportunité d'achat. 🟩🛒
- Divergence baissière : Lorsqu'un signal "D" rouge apparaît sur le graphique, cela indique une possible opportunité de vente. 🟥🚫
- De plus, des lignes reliant les points de divergence sont tracées pour faciliter l'analyse visuelle. 📐🔗
- Prise de décision :
-
- Utilisez ces signaux pour ajuster vos stratégies, comme ouvrir des positions, fermer des trades existants ou ajuster les niveaux de stop-loss. 🤝💼
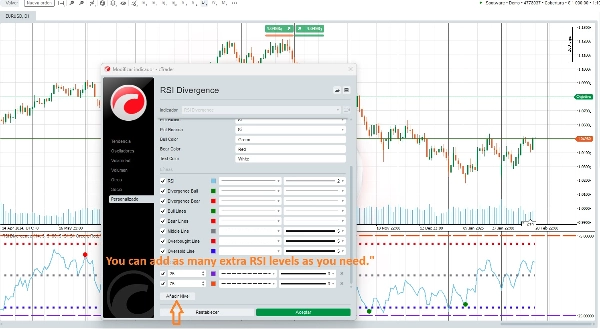
🆕 Personnalisation avancée !
🌟 Vous pouvez ajouter autant de niveaux RSI que l'utilisateur le souhaite 🌟
Cet indicateur vous permet de personnaliser entièrement votre expérience de trading. Vous pouvez ajouter plusieurs niveaux RSI pour l'adapter à différentes stratégies et styles de trading. Par exemple, vous pouvez configurer des niveaux supplémentaires de surachat et de survente ou même ajuster la période du RSI pour convenir à différentes périodes. 🔄📈📉
Résumé
Designed for use on any timeframe, the indicator helps traders identify entry and exit points, anticipate trend changes, and confirm other technical analysis signals. Users can customize parameters such as RSI period, pivot search ranges, signal colors, and enable or disable specific divergence types. Additionally, multiple RSI levels can be added to tailor the indicator to various trading strategies and styles.
This tool is suitable for intraday traders and long-term investors across markets including cryptocurrencies (e.g., BTCUSD), commodities (e.g., gold, XAUUSD), and indices. It supports enhanced decision-making by providing early warnings of trend strength shifts based on RSI divergence analysis.
Avis clients
5 | 0 % | |
4 | 100 % | |
3 | 0 % | |
2 | 0 % | |
1 | 0 % |