present
Đăng ký và nhận ưu đãi $50 cho lần mua đầu tiên
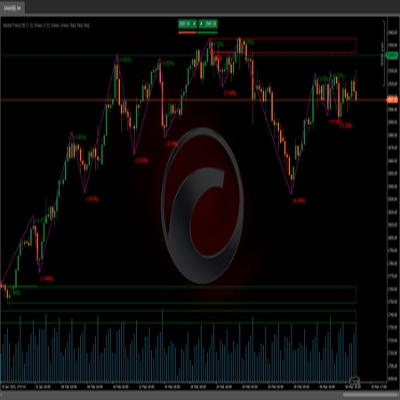
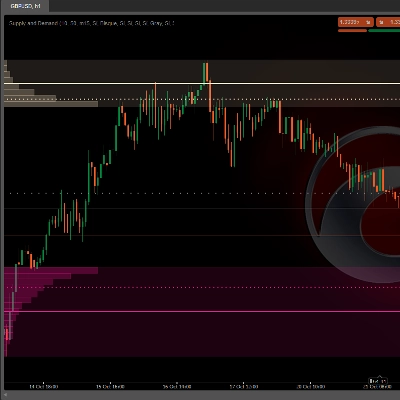
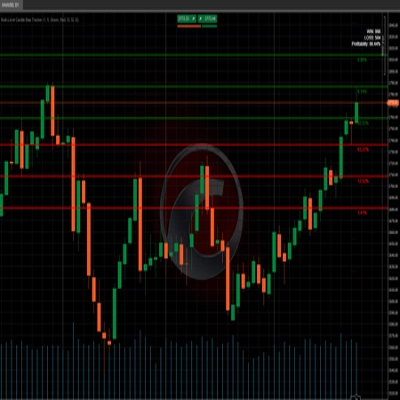
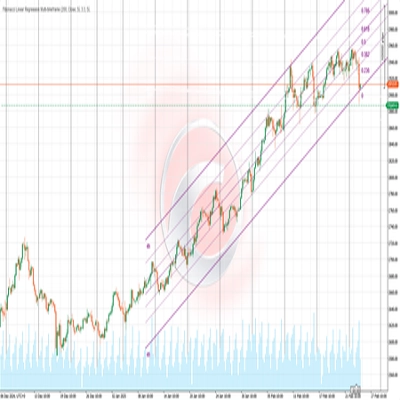
Trading product for Supertrend Chỉ báo BTCUSD Breakout, image 1
Supertrend
4.3
Đánh giá: 3
Kể từ 03/10/2024
178
Lượt bán
45.55K
Cài đặt miễn phí

Mô tả

Chỉ báo Pinescriptlabs Store:                        Pinescriptlabs  Store cBots :  (cBot) Gold & BTC BreakoutSession Pivots(mới)

PRICE ACTION  (Mới)

Thuật toán thông minh theo sau (mới)

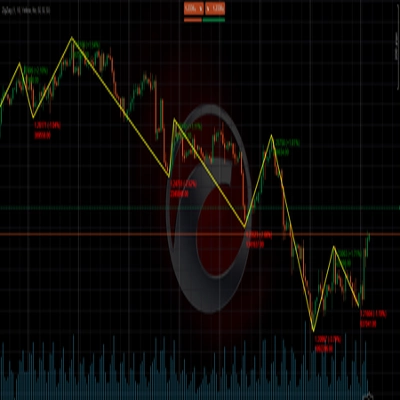
S&R Structural ZigZag                                

ZigZag

 BOS & CHOCH

Vùng cung cầu

Bản đồ thanh lý đòn bẩy

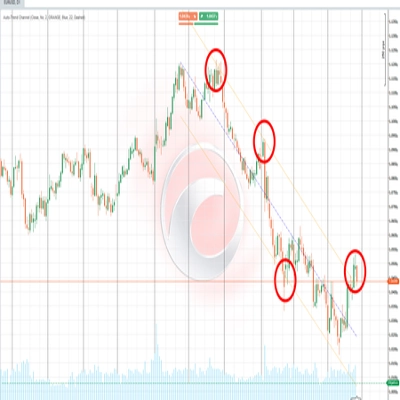
Kênh xu hướng tự động


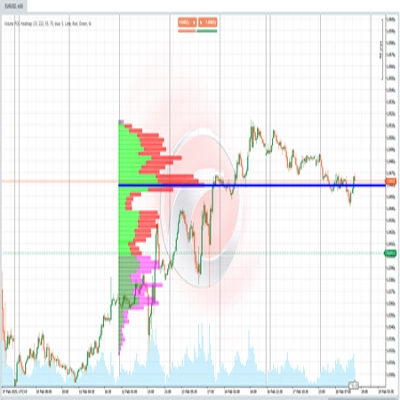
Bản đồ nhiệt Volume POC


KÊNH SSL CAO CẤP

Dự đoán dựa trên Linreg & ATR

 ICT Power of 3 
                                                   

Hỗ trợ &
Kháng cự SmartTrend
Đường
       

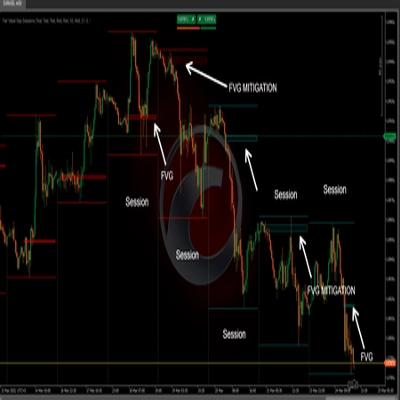
Phiên khoảng trống giá trị hợp lý                


Bộ kích hoạt xu hướng RSI

Hệ thống phá vỡ kênh

Supertrend

Mất cân bằng thị trường

Kênh xu hướng thích ứng 

Phân tích
Cấu trúc thị trường
Động
của
Điểm
Quay đầu

Khối lệnh

Fibonacci
Hồi quy tuyến tính
Đa khung thời gian
Đa khung thời gian

RSI động

Khoảng trống giá trị hợp lý động lượng

Dự báo dòng chảy thị trường

Độ dốc xu hướng động

Theo dõi
Định hướng nến đa cấp
Tracker

Bộ theo dõi cực đoan Zig-Zag

Trung bình động phản ứng

Tự động
Hỗ trợ và
Kháng cự
Xu hướng
Đường

Tất cả
Hỗ trợ và
Kháng cự
Mức

Động lượng phạm vi động

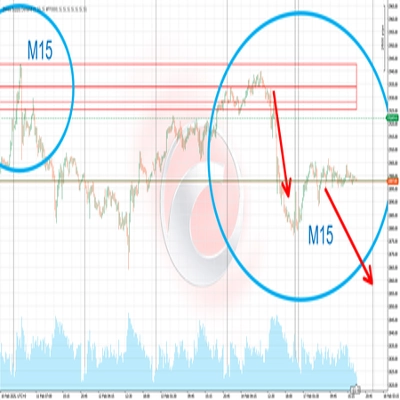
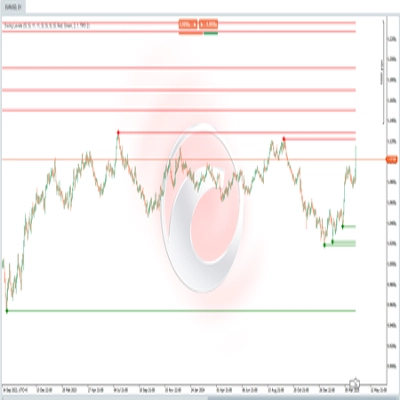
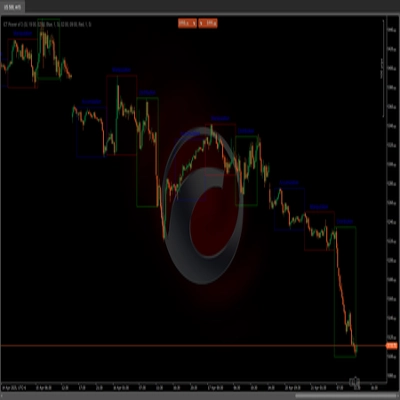
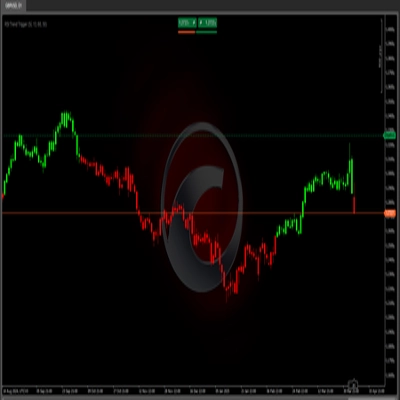
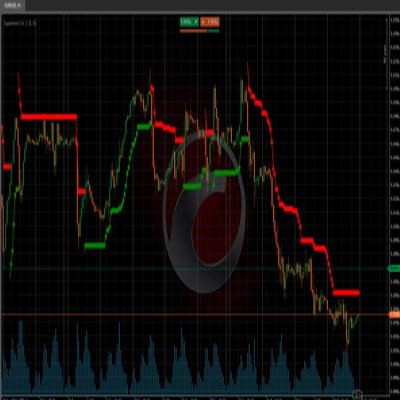
🚀 **Thuật toán theo xu hướng** sử dụng **Average True Range (ATR)** 📊 để xác định kênh giá 📈 và xác định hướng xu hướng (tăng 🟢 hoặc giảm 🔴). Chỉ báo thay đổi màu sắc và vẽ các đường dựa trên xu hướng, giúp dễ dàng hình dung sự thay đổi trong động lượng thị trường. 💹


### 🔧 **Các tham số đầu vào**:


1. **Chu kỳ ATR** ⏳:

- Xác định số chu kỳ để tính **Average True Range**. Điều này ảnh hưởng đến độ nhạy của chỉ báo, giúp bạn nắm bắt biến động thị trường nhanh hơn hoặc chậm hơn.


2. **Hệ số nhân ATR** 🔍:

- Điều chỉnh khoảng cách giữa các đường xu hướng 📉 dựa trên độ biến động thị trường 🌊. Giá trị cao hơn làm rộng kênh, giảm tín hiệu sai nhưng cung cấp cái nhìn rõ ràng hơn về các biến động lớn của thị trường. 📐


Tóm tắt

Tóm tắt AI
The Supertrend indicator is a trend-following tool that uses the Average True Range (ATR) to define a dynamic price channel and identify market trend direction as bullish or bearish. It visually represents trend shifts by changing colors and drawing lines on the price chart, facilitating the recognition of momentum changes. Key adjustable inputs include the ATR Periods, which set the number of periods for ATR calculation affecting sensitivity, and the ATR Multiplier, which adjusts the channel width based on market volatility to balance signal accuracy and noise reduction. This indicator supports analysis across various markets including cryptocurrencies (e.g., BTCUSD), commodities (e.g., gold, XAUUSD), and others. It is designed to help traders visualize and follow prevailing trends by providing clear, adaptive trend signals derived from price action and volatility measures.
Hồ sơ chỉ báo

Thảo luận

Đánh giá của khách hàng

4.3
Đánh giá: 3
5
33 %
4
67 %
3
0 %
2
0 %
1
0 %
Đánh giá của khách hàng
October 6, 2024
Useful in the right hands if the trader wants it helps keep attention on the broader move. It works best as support, not a final decision maker. I would judge the trend read across 3 sessions, with at least 2 higher timeframe candles agreeing. sideways markets can weaken the signal.
October 5, 2024
October 5, 2024
Solid option for review for traders who prefer directional setups. It gives value around trend filtering, but sideways markets can weaken the signal. The signal feels safer when trend strength is clear and DD stays under 3 percent. It is a filter for bias, not a reason to ignore risk.

Câu hỏi thường gặp

BTCUSD
Breakout
Supertrend
Commodities
RSI
Crypto
XAUUSD
ATR
Các sản phẩm có sẵn trên cTrader Store, bao gồm bot giao dịch, chỉ báo và plugin, được cung cấp bởi các nhà phát triển bên thứ ba và chỉ nhằm mục đích cung cấp thông tin và tiếp cận kỹ thuật. cTrader Store không phải là nhà môi giới và không cung cấp lời khuyên đầu tư, khuyến nghị cá nhân hay bất kỳ đảm bảo nào về hiệu suất trong tương lai.

Sản phẩm khác của tác giả này

ZigZag filters noise, spots trends, patterns, pivots, aiding analysis, trade management, and confirmations. 📉📈
📊 Shows volume by price levels, highlights POC, and key zones. Identifies dynamic support/resistance and imbalances.
Adaptive trend channel using linear regression and Pearson correlation for dynamic support, resistance, and trends.
identify and highlight temporary market inefficiencies known as "fair value gaps" 🚨 within specific trading Sessions.
📊Zones Supply & Demand: Identifies key price levels with high volume concentration, marking Supply/Demand Zones & Marke
🔍 Automatically detect support and resistance levels based on "swings" or pivots
🎯 Auto-plots key zones (Accumulation, Manipulation, Distribution) . Reveals institutional traps & trends.
RSI Trend Trigger 📈: Uses dual-layer RSI to spot trends & generate clear buy/sell signals.
Price action to detect when the market changes trend (MSB) and defines, order blocks , ZigZag etc.📊
Auto Supply and Demand Automatically identifies the zones of highest trading activity on your chart. 📊
Price direction by calculating the probability of reaching new highs/lows. Shows levels & stats📈
Combining Fibonacci levels and regression to analyze multidimensional market trends across multiple timeframes¡

Bạn cũng có thể thích

A clean, real-time risk HUD designed to prevent prop firm account failure and protect your challenge account.
The long awaited new and improved Supply Demand Premium V2 indicator. Unlock greater trading opportunities now!
Logo "Titan Pro"
4.3
(3)
$19
Professional trading indicator: 5 cloud types, 9 ML engines, SMC Order Blocks, Pandas-TA & live dashboard.
RSI on the main chart with 45/55 momentum levels, overbought/oversold levels, averaged RSI, and multi-timeframe support.
Overlay HTF context on any chart: color bars by HTF and draw filled HTF bodies with optional High/Low lines.
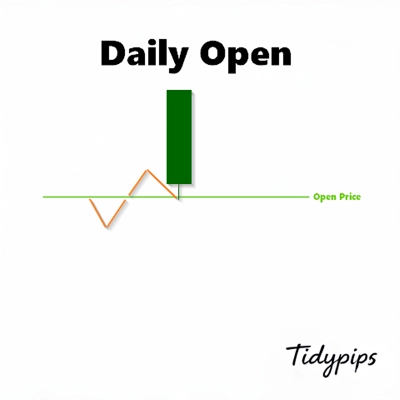
This indicator is a valuable tool for traders looking to identify significant opening price level of any asset.
IBS Indicator – Measures price position within bars for smarter trades. Works on all markets & timeframes.
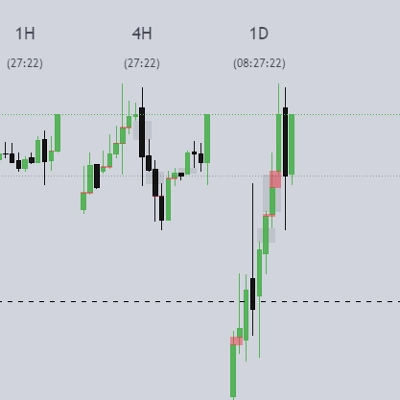
ICT HTF Candles- The Ultimate Multi-Timeframe Dashboard Stop switching timeframes and losing focus.
Alpha Sentiment Pro - See the Market's Pulse Before It Moves
Instantly spot high-liquidity institutional moves with clean, non-obtrusive triangle alerts on cTrader charts.
VWAP Bands indicator with 3 standard deviation levels, buy/sell zones, and a draggable ON/OFF button to toggle the entir
🎯Automatically identifies the market's significant turning points (key H & L) and draws dynamic support and.....✍️
E7 BBKG indicator with 80% plus accuracy used to show both, possible reversal and trend.
Protect your funded account. Real-time Daily Equity Drawdown monitor with Green / Orange / Red flashing alerts.
Multi-timeframe candlesticks!
Bollinger Bands Advanced Squeeze & Breakout System, Real-Time On-Chart Dashboard, Auto-Squeeze Detector, Dual-Band Cloud
Super Trend Rsi ,ATR + trend change distance + dynamic Alpha, divergence/convergence
Professional Trading Indicator Transform Your Trading with Intelligent Signal Detection RenkoProfit

Giá

Kể từ 03/10/2024
178
Lượt bán
45.55K
Cài đặt miễn phí