Описание
Индикаторы Pinescriptlabs Store: Pinescriptlabs Store cBots : (cBot) Gold & BTC BreakoutSession Pivots(новинка)
Advanced Market Structure: Bos, Choch, SwinLevels, Order Blocks, Market Structure & Liquidity Finder (Новинка)
ZigZag Price Liquidity Projection
Trailing Smart Algorithm (новинка)
Прогноз на основе Linreg & ATR
SmartTrend Support &
Resistance
Lines
Динамический
Анализ
Структуры Рынка
Поворотных
Точек
Points
Фибоначчи
Линейная
Регрессия
Мультивременной
Многоуровневый
Трекер Свечных Смещений
Tracker
Авто
Поддержка и
Сопротивление
Трендовые
Линии
Все
Уровни поддержки и
Сопротивления
Levels
Динамический Диапазон Моментума
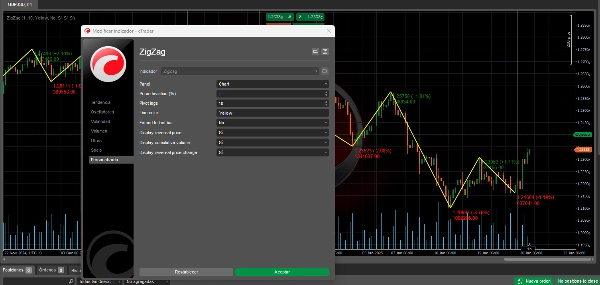
Индикатор ZigZag: упрощение рыночных трендов 📉📈
ZigZag — это технический индикатор, который помогает выявлять значительные изменения тренда актива, фильтруя мелкие колебания рынка. Его основная цель — упростить визуальный анализ цены, устраняя «шум» мелких флуктуаций.
Как это работает ⚙️
- 📊 Анализирует цены для поиска значимых поворотных точек (пивотов).
- 📈 Поворотная точка считается значимой, когда цена меняется на определённый минимальный процент (параметр отклонения).
- 🔗 Соединяет эти поворотные точки прямыми линиями, формируя «зигзагообразный» узор.
- 🕒 Обновляется динамически по мере поступления новых данных о цене.
Полезность для трейдинга 💡
Определение тренда 📐
- 🔍 Помогает визуализировать основное направление рынка.
- 🚀 Облегчает выявление бычьих и медвежьих трендов.
- 📏 Чётко выделяет ключевые уровни поддержки и сопротивления.
Анализ паттернов 📋
- 🎯 Упрощает идентификацию графических паттернов.
- 🕵️♂️ Выделяет ценовые формации, такие как треугольники, флаги и другие паттерны.
- 🌊 Повышает ясность при распознавании волн Эллиотта.
Управление сделками 🎛️
- 🎯 Определяет потенциальные точки входа и выхода.
- 🛡️ Помогает определить уровни стоп-лосса на основе предыдущих пивотов.
- 🎯 Облегчает установку реалистичных ценовых целей.
Анализ волатильности 🌡️
- 📏 Расстояние между пивотами отражает волатильность рынка.
- 🧩 Помогает корректировать стратегии в зависимости от размера движений.
- ⏳ Различает периоды консолидации и направленные тренды.
Подтверждение сигналов ✅
- 🔍 Служит инструментом подтверждения для других индикаторов.
- 🚪 Подтверждает пробои ключевых уровней.
- 🔗 Может комбинироваться с другими индикаторами для более надёжных стратегий.
Ключевые моменты 🧠
Это ретроспективный индикатор 📅
- ⏪ Поворотные точки подтверждаются только после того, как движение произошло.
- 🔮 Сам по себе не является предсказательным.
- ⚖️ Следует использовать в сочетании с другими индикаторами для принятия решений.
Настройка параметров 🔧
- 🎚️ Чувствительность зависит от установленного процента отклонения.
- 🔍 Меньший процент показывает больше пивотов.
- 🧹 Больший процент фильтрует мелкие движения, показывая только значительные изменения.
Использование таймфреймов 🕒
- 🕰️ Работает на любом таймфрейме.
- 🔄 Параметры должны настраиваться в зависимости от торговых горизонтов.
- 🌐 Анализ на нескольких таймфреймах даёт более полное представление.
📈 Используйте индикатор ZigZag как мощный инструмент для упрощения анализа, выявления трендов и улучшения принятия решений в вашем торговом пути! 🚀
Сводка
Key functionalities include:
- Trend Identification: Visualizes primary market direction, highlights bullish and bearish trends, and marks key support and resistance levels.
- Pattern Analysis: Simplifies recognition of chart patterns such as triangles, flags, and Elliott waves.
- Trade Management: Assists in identifying entry and exit points, setting stop-loss levels based on previous pivots, and establishing realistic price targets.
- Volatility Analysis: Reflects market volatility through pivot distances, aiding strategy adjustments and distinguishing consolidation from trending phases.
- Signal Confirmation: Validates breakouts and complements other indicators for robust trading strategies.
The indicator is retrospective, confirming pivots only after price movements occur, and is not predictive on its own. Sensitivity can be adjusted via the deviation percentage to show more or fewer pivot points. It is compatible with any timeframe and benefits from multi-timeframe analysis for comprehensive market views.
This tool supports analysis across various markets including cryptocurrencies (BTCUSD), commodities (XAUUSD), and others, and integrates with related indicators like RSI, ATR, and Supertrend.
Отзывы покупателей
5 | 50 % | |
4 | 33 % | |
3 | 17 % | |
2 | 0 % | |
1 | 0 % |