
E7 BBKG Indicator
Indicatore
2 acquisti
Versione 1.0, Feb 2025
Windows, Mac
5.0
Recensioni: 2
Descrizione
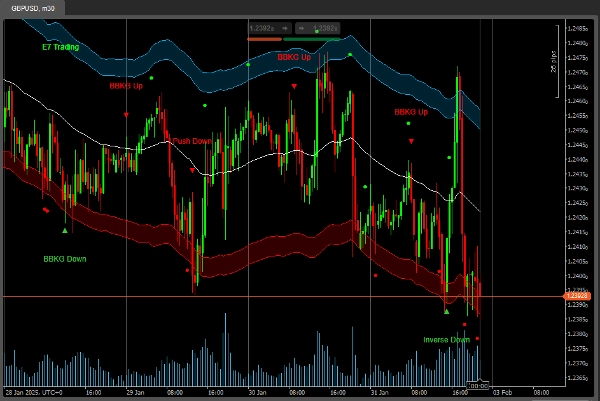
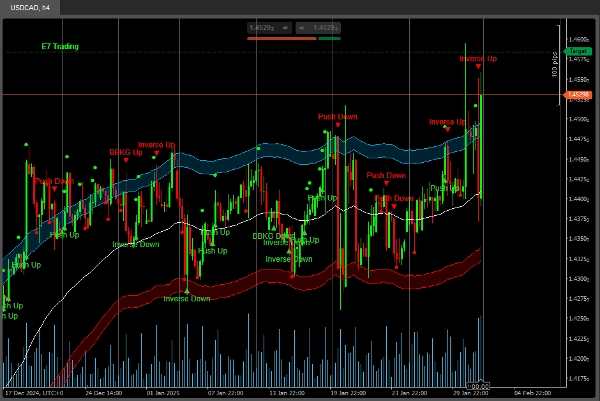
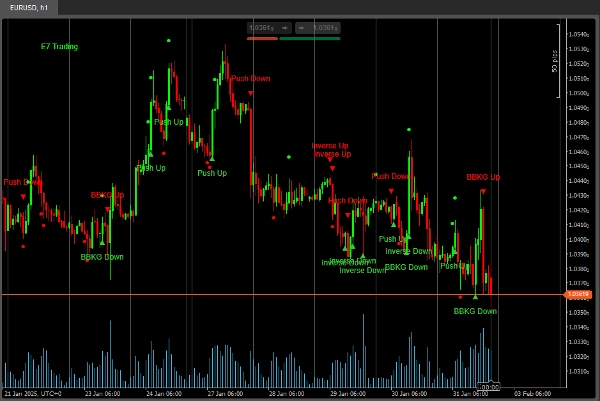
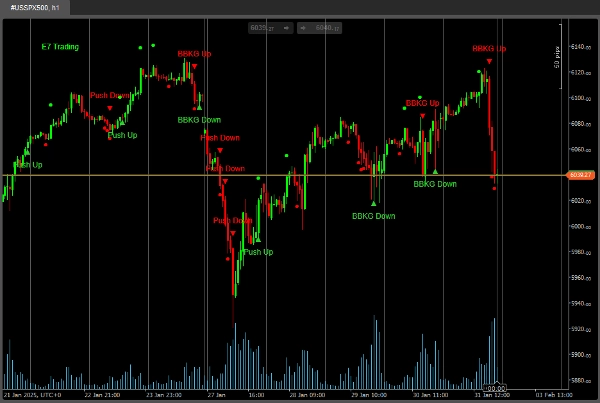
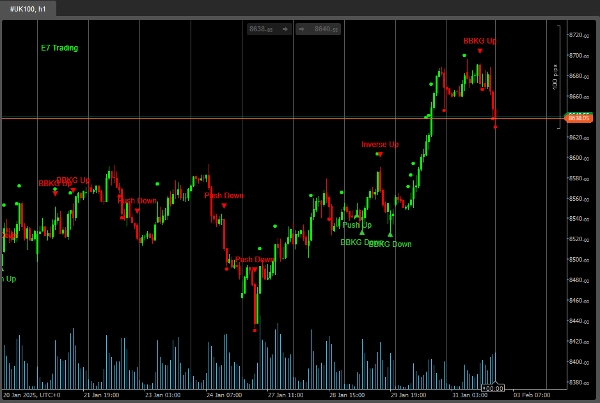
Con un tasso di precisione superiore all'80%, questo è un indicatore personalizzato utilizzato per mostrare sia le possibili inversioni che le aree di tendenza nei movimenti dei prezzi. Idealmente usato con il sistema E7.
Questo è un indicatore personalizzato e proprietario sviluppato utilizzando il sistema di apprendimento profondo E7Qnet.
Alcune delle immagini qui sotto includono il nostro indicatore personalizzato E7 Polynomial Regression Channel come usato nella strategia E7.
Buona caccia!
Riepilogo
Riepilogo AI
The E7 BBKG Indicator is a custom proprietary trading indicator developed using the E7Qnet deep neural network learning system. It is designed to identify potential price reversal and trending areas with an accuracy rate exceeding 80%. This indicator is ideally used in conjunction with the E7 trading system and supports analysis across various markets, as demonstrated in examples including currency pairs like GBPUSD, USDCAD, EURUSD, and indices such as S&P500 and UK100. The product incorporates advanced machine learning techniques to enhance the detection of significant price movement zones, aiding traders in decision-making. Visual references include the E7 Polynomial Regression Channel indicator, which complements the E7 strategy.
Profilo indicatore
Recensioni dei clienti
5.0
Recensioni: 2
5 | 100 % | |
4 | 0 % | |
3 | 0 % | |
2 | 0 % | |
1 | 0 % |
Recensioni dei clienti
February 3, 2025
Discussioni
Domande frequenti
Prop
I prodotti disponibili tramite cTrader Store, inclusi bot di trading, indicatori e plugin, sono forniti da sviluppatori terzi e resi disponibili esclusivamente a scopo informativo e di accesso tecnico. cTrader Store non è un broker e non fornisce consulenze in materia di investimento, raccomandazioni individualizzate o garanzie di risultati futuri.
Altro da questo autore


![Logo di "[CB] Pivot Points Pro"](https://cdn.ctrader.com/image/webp/43463c82-67b0-4f10-a4ba-901bba091d81_32594)


Prezzo
Da 18/12/2024
2
Vendite
4.26K
Installazioni gratuite