
E7 BlackScholes Model
Indicatore
254 download
Versione 1.0, Feb 2025
Windows, Mac
5.0
Recensioni: 1
Descrizione
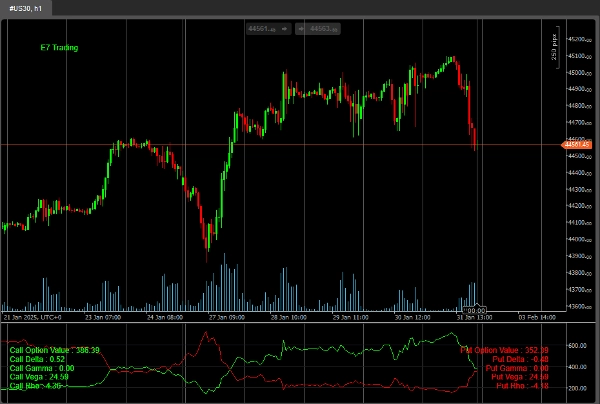
Questo è un esempio molto semplice di utilizzo del pacchetto ‘Math.Numerics’ all'interno di cTrader per calcolare il prezzo delle opzioni usando il modello BlackScholes.
Le versioni future includeranno implementazioni più sofisticate.
Per ora dovrebbe essere usato solo per gli indici, grazie.
Buona caccia!
Riepilogo
Riepilogo AI
E7 BlackScholes Model is an indicator designed for use within the cTrader platform that calculates option pricing based on the Black-Scholes model. It utilizes the Math.Numerics package to perform these calculations. Currently, the tool is intended primarily for indices such as NASDAQ, S&P 500, DAX, and Dow. The product offers a straightforward implementation of the Black-Scholes formula, with plans for more advanced versions in the future. This indicator assists traders in evaluating option prices on index markets by providing mathematical option valuation directly integrated into their trading environment.
Profilo indicatore
Recensioni dei clienti
5.0
Recensioni: 1
5 | 100 % | |
4 | 0 % | |
3 | 0 % | |
2 | 0 % | |
1 | 0 % |
Recensioni dei clienti
August 18, 2025
Pros: Calculates Black–Scholes theoretical option price and Greeks (Delta, Gamma, Theta, Vega) in real‑time. Lightweight and intuitive interface. Great for risk management and option analysis. Cons: No alerts or tooltips. Lacks template saving and real‑price comparison. Assumes constant volatility
Discussioni
Domande frequenti
Indices
I prodotti disponibili tramite cTrader Store, inclusi bot di trading, indicatori e plugin, sono forniti da sviluppatori terzi e resi disponibili esclusivamente a scopo informativo e di accesso tecnico. cTrader Store non è un broker e non fornisce consulenze in materia di investimento, raccomandazioni individualizzate o garanzie di risultati futuri.
Altro da questo autore


Prezzo
Da 18/12/2024
2
Vendite
4.26K
Installazioni gratuite