
Descrizione
🏆 Oltre 10.000 trader si affidano alla nostra suite di oltre 25 algoritmi! 🏆
Da Struttura di Mercato e Liquidità a Sistemi di Uscita Intelligenti e Strumenti Predittivi - abbiamo costruito OGNI strumento di cui hai bisogno per la coerenza.
👉 Accedi a tutti i 25+ sistemi PROVATI:
_______________________________________________
📌 Indicatori di Struttura di Mercato
· ✅ AdvancedMarket Structure: Bos, Choch, SwinLevels, Order Blocks, Market Structure& Liquidity Finder
· 🔄 Analisi Dinamica della Struttura di Mercato dei Punti di Inversione
· 🧱 Order Block
· ⛓️ BOS & CHOCH
· 🧠 ICT Power of 3
· 🌀 Zone di Polarità di Mercato
_______________________________________________
🔚 Sistemi di Uscita Intelligenti
· 📍 Algoritmo Intelligente a Inseguimento
_______________________________________________
📐 Indicatori ZigZag
· 🔍 Proiezione di Liquidità del Prezzo ZigZag
· ➖ ZigZag
· 🎯 Tracciatore di Estremità Zig-Zag
_______________________________________________
🧱 Indicatori di Supporto e Resistenza
· 🟩 Linee di Supporto e Resistenza SmartTrend
· 🧱 Tutti i Livelli di Supporto e Resistenza
_______________________________________________
📊 Indicatori di Trend e Canale
· 🔄 Canale di Trend Automatico
· 📊 Supertrend
· ⚡Analizzatore di Trend Momentum
· 💥 Sistema di Rottura del Canale
· 🌈 Gradiente di Trend Dinamico
_______________________________________________
💧 Strumenti di Volume e Liquidità
· 📉 Mappa di Liquidazione Leva
_______________________________________________
⚡ Indicatori di Momentum e RSI
· 🔎 Tracciatore di Bias a Candele Multi-Livello
_______________________________________________
🔮 Strumenti di Predizione e Proiezione
· 📐 Predizione basata su Linreg & ATR
· 📏 Regressione Lineare Fibonacci Multi-timeframe
· 📈 Proiettore di Flusso di Mercato Alimentato dal Volume_________________________
_________________________________________________________________________________________________
_________________________________________________________________________________________________
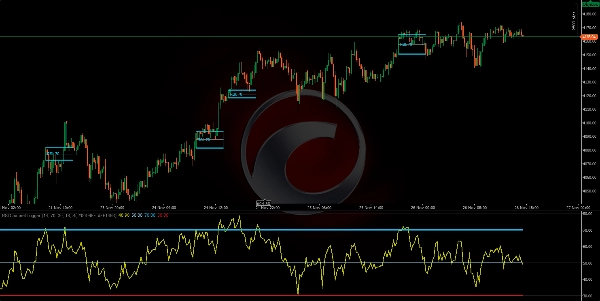
TRIGGER CANALE RSI: 📶
Cos'è: Un indicatore che calcola l'RSI(periodo) e segna visivamente le zone di momentum quando l'RSI attraversa le soglie di ipercomprato/ipervenduto (default 70/30). ✅
https://chartshots.spotware.com/c/69278f8b6d973
Logica: Quando una soglia viene superata, crea una "zona" basata sul massimo/minimo della candela al momento del crossover. Poi: 🧠
- Colore le candele all'interno di quella zona.
- Disegna un canale (massimo, minimo, medio).
- Segna il crossover sul pannello RSI con un cerchio e un'etichetta.
La zona dura esattamente MinZoneDuration barre. ⏱️
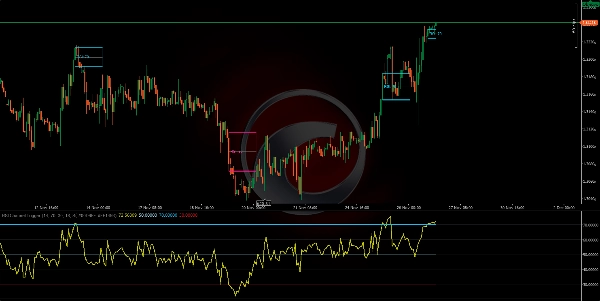
Segnali chiari:
- Crossover sopra Ipercomprato → innesca una zona rialzista. 🟢
- Crossover sotto Ipervenduto → innesca una zona ribassista. 🔴
La zona stessa è un area di interesse, non un ordine.
https://chartshots.spotware.com/c/69278fb274e0b
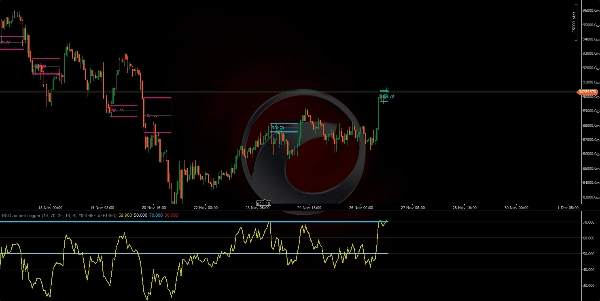
Come usarlo (rapido):
- Aspetta che la zona si formi. 🎯
- Conferma con azione del prezzo (breakout/rifiuto dalle linee del canale).
- Entra con uno stop loss fuori dalla zona e un obiettivo alla linea mediana del canale o a un rapporto Rischio/Rendimento definito.
https://chartshots.spotware.com/c/69278fe76237b
Parametri chiave: ⚙️
- Periodo RSI (14)
- Ipercomprato (70)
- Ipervenduto (30)
- MinZoneDuration (15)
- Colori configurabili 🎨
Riepilogo
Clear signals include:
- RSI crossing above the overbought level, initiating a bullish momentum zone.
- RSI crossing below the oversold level, initiating a bearish momentum zone.
These zones serve as areas of interest rather than direct trade orders. Users can confirm signals with price action such as breakouts or rejections from channel lines and plan entries with stop losses placed outside the zone and targets at the mid-channel line or based on risk/reward ratios.
The indicator supports multiple markets and symbols including Forex pairs (EURUSD, GBPUSD, NZDUSD, USDJPY), commodities (XAUUSD), indices (NAS100), cryptocurrencies (BTCUSD), and stocks. It offers configurable parameters for RSI period, threshold levels, zone duration, and colors.


![Logo di "[Hamster-Coder] Moving Average"](https://cdn.ctrader.com/image/webp/1bd952ad-57d2-4db2-9b49-b01be0b048b8_30113)


