
LT_FairValueGap
Indicatore
1 acquisti
Versione 1.0, Jun 2025
Windows, Mac
5.0
Recensioni: 1
Descrizione
Nota: Testato solo su cTrader Windows.
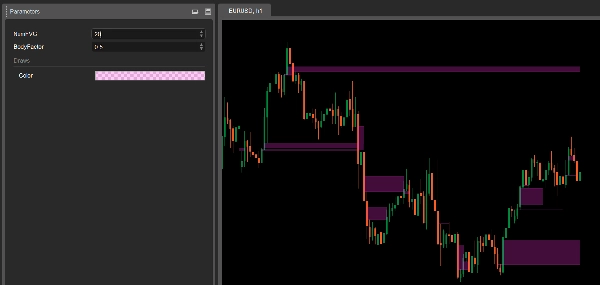
LT_FairValueGap è un indicatore leggero e potente di Fair Value Gap progettato per trader di price action di precisione. Evidenzia zone di squilibrio in stile istituzionale utilizzando una logica rigorosa a 3 barre e le rimuove una volta che il prezzo ritorna al gap — fornendoti zone pulite e azionabili per ingressi, uscite o confluences.
🔍 Come Funziona
- Un Fair Value Gap (FVG) viene identificato quando una candela centrale forte (con corpo grande) crea uno squilibrio tra due candele adiacenti.
- Il gap viene segnato come una zona temporanea di supporto/resistenza (SR).
- Una volta che il prezzo ritorna e riempie il gap, la zona non si estende più — garantendo che i grafici rimangano ordinati e rilevanti.
⚙️ Parametri
- NumFVG: Numero massimo di zone FVG da mostrare sul grafico.
- BodyFactor: Soglia di forza per la barra centrale (default:
2.0×corpo medio delle ultime 20 barre).
✅ Caratteristiche Principali
- Rilevamento gap in stile istituzionale (logica a 3 barre)
- Grafici puliti — le zone smettono di estendersi una volta raggiunte
- Sensibilità regolabile tramite BodyFactor
- Plug-and-play: configurazione minima
📌 Casi d'Uso
- Identificare squilibri istituzionali e zone di reazione
- Usare come confluences di ingresso o marker di invalidazione
- Combinare con struttura swing o strumenti di volume
Che tu stia facendo trading su breakout, mitigazioni o inversioni, LT_FairValueGap ti aiuta a individuare le vere zone di squilibrio che contano — senza il rumore.
Riepilogo
Profilo indicatore
Recensioni dei clienti
5.0
Recensioni: 1
5 | 100 % | |
4 | 0 % | |
3 | 0 % | |
2 | 0 % | |
1 | 0 % |
Recensioni dei clienti
June 25, 2025
Ngl, market notes are quicker to compare and that is enough to keep testing it. It should not replace the chart.
Discussioni
Domande frequenti
Forex
I prodotti disponibili tramite cTrader Store, inclusi bot di trading, indicatori e plugin, sono forniti da sviluppatori terzi e resi disponibili esclusivamente a scopo informativo e di accesso tecnico. cTrader Store non è un broker e non fornisce consulenze in materia di investimento, raccomandazioni individualizzate o garanzie di risultati futuri.


Prezzo
Da 25/09/2024
34
Vendite