
Descrizione
Hull Moving Average Colored – Direzione del Trend a Colpo d'Occhio
Panoramica
Hull Moving Average Colored è un indicatore di tendenza semplificato che applica la reattività della Hull Moving Average con segnali direzionali codificati a colori. Visualizzando i trend rialzisti in verde e i trend ribassisti in rosso, fornisce una conferma visiva immediata della direzione del momentum senza richiedere analisi complesse.
Cosa Fa
Fondamento della Hull Moving Average: L'indicatore utilizza la Hull Moving Average (HMA), una media mobile a reazione rapida progettata per ridurre il ritardo mantenendo la fluidità. A differenza delle medie mobili tradizionali, la HMA dà priorità all'azione di prezzo recente, rendendola particolarmente utile per cogliere precocemente i cambiamenti di trend.
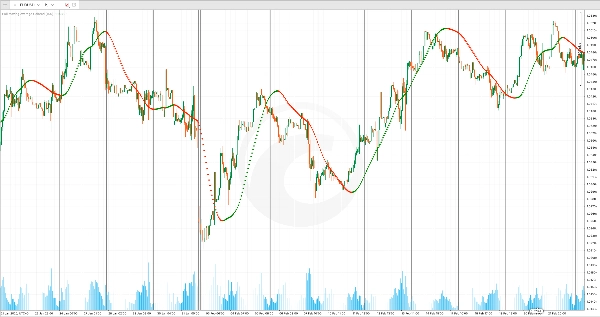
Visualizzazione del Trend Codificata a Colori: Invece di una singola linea, l'indicatore traccia punti direzionali:
- Punti Verdi: Appaiono quando la HMA è in salita, indicando momentum rialzista
- Punti Rossi: Appaiono quando la HMA è in discesa, indicando momentum ribassista
Questo sistema binario di colori rende la direzione del trend inequivocabile a colpo d'occhio—non è necessario interpretare la pendenza o confrontare con barre precedenti.
Caratteristiche Principali
Visualizzazione Sovrapposta: L'indicatore viene tracciato direttamente sul grafico dei prezzi, permettendoti di vedere la direzione del trend in relazione ai livelli di prezzo effettivi. Questo rende facile individuare quando il prezzo supera o scende sotto la media mobile, segnalando potenziali punti di ingresso e uscita.
Riduzione del Ritardo Reattiva: La Hull Moving Average reagisce più rapidamente rispetto alle medie mobili esponenziali o semplici standard, risultando particolarmente efficace per trader swing e intraday che necessitano di segnali tempestivi senza eccessivi falsi segnali.
Personalizzazione Semplice: Regola il parametro Periodo per controllare la sensibilità. Periodi più brevi (es. 20-32) rendono l'indicatore più reattivo ai movimenti recenti ma soggetto a falsi segnali in mercati agitati. Periodi più lunghi (es. 64-128) offrono trend più fluidi con meno falsi breakout ma possono perdere inversioni rapide.
Uso Pratico
Usa Hull Moving Average Colored come filtro rapido per la direzione del trade. Prendi solo posizioni long quando appaiono punti verdi e il prezzo è sopra la media; prendi solo posizioni short quando appaiono punti rossi e il prezzo è sotto la media. Al contrario, considera i cambi di colore come potenziali segnali di uscita—quando il verde passa al rosso, è il momento di rivalutare le posizioni long.
L'indicatore funziona bene in mercati trend e risulta particolarmente utile su timeframe più alti (4 ore e giornaliero) dove può aiutarti ad allinearti con il bias direzionale più ampio prima di operare su setup a timeframe inferiori.
Riepilogo
This indicator overlays directly on price charts and uses a binary color system to indicate trend direction: green points appear when the HMA is rising, signaling upward momentum, and red points appear when the HMA is falling, signaling downward momentum. This visual approach allows traders to quickly identify trend direction without interpreting slopes or comparing previous bars.
Users can adjust the period parameter to control sensitivity—shorter periods increase responsiveness but may generate more false signals, while longer periods smooth trends but may delay signals. The indicator is suitable for various markets including Forex, indices, stocks, and cryptocurrencies such as BTCUSD and XAUUSD. It is particularly useful on higher timeframes (4-hour and daily) for aligning with broader market trends and can assist in identifying potential entry and exit points based on trend changes.
Recensioni dei clienti
5 | 0 % | |
4 | 100 % | |
3 | 0 % | |
2 | 0 % | |
1 | 0 % |


