
Mô tả
MFI-MTF: Chỉ số Dòng Tiền Đa Khung Thời Gian
Tổng quan
MFI- MTF là một chỉ báo động lượng đa khung thời gian mang lại góc nhìn khung thời gian cao hơn cho biểu đồ hiện tại của bạn. Bằng cách tính toán Chỉ số Dòng Tiền (MFI) trên khung thời gian lớn hơn và hiển thị nó trên biểu đồ làm việc của bạn, chỉ báo này giúp bạn xác định các điều kiện mua quá mức và bán quá mức trên nhiều góc nhìn thị trường mà không cần phải chuyển đổi thủ công giữa các khung thời gian.
Nó làm gì
Phân tích Chỉ số Dòng Tiền: Chỉ báo đo lường áp lực mua và bán bằng cách phân tích cả biến động giá và khối lượng giao dịch. Nó dao động giữa 0 và 100, xác định khi một tài sản đã trải qua áp lực mua quá mức (mua quá nhiều) hoặc bán quá mức (bán quá nhiều).
Bối cảnh Khung Thời Gian Cao Hơn: Thay vì tính MFI trên khung thời gian biểu đồ hiện tại của bạn, MFIMTF lấy dữ liệu từ một khung thời gian lớn hơn mà bạn chỉ định (hàng ngày, hàng tuần, 4 giờ, v.v.). Điều này cung cấp cho bạn cái nhìn sâu sắc về động lượng cấp độ tổ chức mà không bị nhiễu từ các khung thời gian thấp hơn. Khi MFI hàng ngày cho thấy điều kiện mua quá mức, ví dụ, bạn biết xu hướng lớn hơn đang đến gần mức kiệt sức — bối cảnh quý giá cho các quyết định vào và ra lệnh.
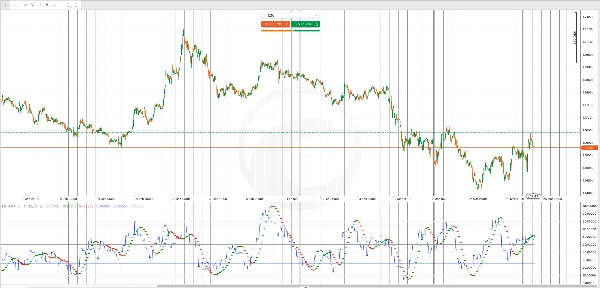
Bộ Lọc Trung Bình Động Hull: Một Trung Bình Động Hull (HMA) áp dụng cho MFI giúp làm mượt các dao động giả và làm nổi bật các chuyển động động lượng theo hướng. Các chấm màu xanh lá đánh dấu xu hướng tăng động lượng, trong khi các chấm màu đỏ đánh dấu xu hướng giảm, giúp bạn xác nhận nhanh sự thay đổi hướng động lượng bằng hình ảnh.
Các Kết Quả Chính
Đường MFI (Màu Xanh): Giá trị chính của Chỉ số Dòng Tiền từ khung thời gian cao hơn bạn chọn, hiển thị trên mỗi thanh của biểu đồ hiện tại.
Tín hiệu HMA (Chấm Xanh Lá/Đỏ): Các điểm xanh lá xuất hiện khi động lượng đang tăng cường; các điểm đỏ xuất hiện khi động lượng yếu đi hoặc đảo chiều giảm. Đây là các tín hiệu cảnh báo sớm cho các khả năng đảo chiều.
Mức Tham Chiếu:
- Mức Mua Quá Mức (mặc định 70): Khi MFI vượt quá mức này, áp lực mua là quá mức và khả năng đảo chiều tăng lên
- Mức Bán Quá Mức (mặc định 30): Khi MFI giảm xuống dưới mức này, áp lực bán đã cạn kiệt và khả năng bật lên trở nên cao
- Đường Giữa (50): Điểm cân bằng trung lập giữa động lượng tăng và giảm
Tùy chỉnh
Chọn Khung Thời Gian: Chọn bất kỳ khung thời gian nào cao hơn biểu đồ hiện tại của bạn (ví dụ: hàng ngày trên biểu đồ 1 giờ). Khung thời gian lớn hơn cung cấp bối cảnh xu hướng rộng hơn nhưng tín hiệu ít hơn; các bước nhỏ hơn cung cấp nhiều cơ hội giao dịch hơn nhưng với góc nhìn chiến lược ít hơn.
Chu kỳ MFI: Điều chỉnh chu kỳ nhìn lại cho Chỉ số Dòng Tiền (mặc định 14). Chu kỳ ngắn hơn làm cho chỉ báo phản ứng nhanh hơn với thay đổi khối lượng gần đây; chu kỳ dài hơn làm mượt biến động và giảm tín hiệu sai.
Chu kỳ HMA: Kiểm soát độ mượt của bộ lọc động lượng. Chu kỳ ngắn hơn làm cho sự thay đổi xu hướng rõ ràng hơn nhưng ồn hơn; chu kỳ dài hơn xác nhận xu hướng đáng tin cậy hơn nhưng tín hiệu xuất hiện chậm hơn.
Ngưỡng Mua Quá Mức/Bán Quá Mức: Tùy chỉnh các mức này để phù hợp với phong cách giao dịch của bạn. Nhà giao dịch thận trọng có thể dùng 75/25; nhà giao dịch tích cực có thể dùng 80/20 để chờ điều kiện cực đoan hơn.
Sử dụng Thực tế
Sử dụng MFI MTF để tăng độ tin cậy cho các điểm vào và ra lệnh của bạn. Tín hiệu bán trên khung thời gian làm việc của bạn trở nên đáng tin cậy hơn nếu MFI hàng ngày đã ở mức mua quá mức, cho thấy người bán tổ chức có thể đang hoạt động. Tương tự, tín hiệu mua mạnh hơn khi MFI khung thời gian cao hơn ở mức bán quá mức, cho thấy áp lực bán đã cạn kiệt ở cấp độ vĩ mô.
Sự thay đổi màu sắc của HMA cung cấp cho bạn cảnh báo thời gian thực về các chuyển động động lượng, giúp bạn thoát khỏi các giao dịch thua lỗ sớm hoặc giảm kích thước vị thế trước khi các đảo chiều trở nên nghiêm trọng.
Tóm tắt
The indicator includes a Hull Moving Average (HMA) filter applied to the MFI to smooth out noise and highlight momentum shifts. Green dots indicate strengthening upward momentum, while red dots signal weakening or downward momentum. Reference levels include default overbought (70), oversold (30), and a neutral midpoint (50), all customizable to fit different trading styles.
Key outputs are the MFI line from the chosen higher timeframe and HMA signals for momentum direction changes. Adjustable parameters include the MFI lookback period, HMA smoothing period, and overbought/oversold thresholds. MFI-MTF aids in confirming entry and exit points by providing institutional-level momentum insights and real-time alerts to momentum shifts on your working chart.
Đánh giá của khách hàng
5 | 100 % | |
4 | 0 % | |
3 | 0 % | |
2 | 0 % | |
1 | 0 % |


![Logo "[Hamster-Coder] Pivot Points MTF"](https://cdn.ctrader.com/image/webp/4c143e5a-309c-40e3-a578-f04d1e133ffa_31159)


