
Açıklama
Pinescriptlabs Mağaza göstergeleri: Pinescriptlabs Mağaza cBots : (cBot) Gold & BTC BreakoutOturum Pivotları(yeni)
SmartTrend Destek &
Direnç
Çizgileri
Dinamik
Piyasa Yapısı
Analizi
Dönüş
Noktaları
Analizi
Fibonacci
Doğrusal
Regresyon
Çok Zamanlı
Çok Seviyeli
Mum Eğilimi
Takipçisi
Otomatik
Destek ve
Direnç
Trend
Çizgileri
Tüm
Destek ve
Direnç
Seviyeleri
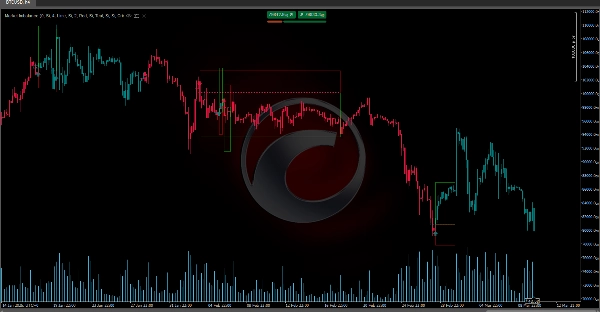
MarketImbalanceDetector piyasa dengesizliklerini tanımlar ve fiyat desenleri ile volatiliteye (ATR) dayalı olarak önemli alanları görsel olarak işaretler. İşte nasıl çalıştığının basit bir özeti:
🔍 Sinyal Tespiti
Önceki barların fiyatlarını karşılaştırarak yükseliş veya düşüş desenlerini tespit eder. Belirli koşullar (örneğin önceki barların düşük ve yükseklerini karşılaştırmak) kullanarak ve mevcut volatilite ile sinyalleri filtreleyerek hareketin anlamlı olmasını sağlar.
📊 Dengesizliklerin Görselleştirilmesi
Bir sinyal tespit edildiğinde, gösterge grafikte şunları çizer:
- Bir Dengesizlik Alanı (desenin oluştuğu bölgeyi işaretleyen bir dikdörtgen).
- Ortalama Seviye Çizgisi (ilgili yüksek ve düşüklerden hesaplanır) destek veya direnci görselleştirmeye yardımcı olur.
- Bir Simge (bir ok) sinyal yönünü gösterir (⬆️ yükseliş için, ⬇️ düşüş için).
OP/PE Bölgeleri
Ayrıca, OP () ve PE (Kaçış Noktası) adında bölgeler oluşturur. Bu bölgeler, ortalama seviyeye ATR'nin bir katını ekleyip çıkararak hesaplanır ve kar alma veya zararı durdurma alanlarını tanımlamaya yardımcı olur.
Özet
When a signal is detected, the indicator visually marks the chart with:
- An Imbalance Area (a rectangle) highlighting the zone where the pattern occurred.
- An Average Level Line calculated from relevant highs and lows to indicate potential support or resistance.
- An Icon (arrow) showing the signal direction: upward for bullish and downward for bearish.
Additionally, the indicator calculates OP (Order Point) and PE (Escape Point) zones by adding or subtracting multiples of ATR to the average level. These zones assist traders in defining areas for taking profit or cutting losses.
This tool supports analysis across various markets including cryptocurrencies (e.g., BTCUSD), commodities (e.g., XAUUSD), and integrates concepts related to breakout strategies, trend indicators like Supertrend, and momentum measures such as RSI. It is intended to enhance market structure understanding and assist in decision-making by visually representing key imbalance zones on trading charts.


