
الوصف
🚀 أكثر من 10,000 متداول يستخدمون بالفعل أفضل المؤشرات🏆
اكتشف لماذا يختارنا المحترفون – أقوى الأدوات على cTrader (المؤشرات، الخوارزميات، وcBots) في انتظارك.
👉 احصل على جميع أنظمتنا الأفضل هنا:
_______________________________________________
📌 مؤشرات هيكل السوق
· ✅ هيكل السوق المتقدم: Bos, Choch, SwinLevels, كتل الأوامر، هيكل السوقومكتشف السيولة
· 🔄 تحليل هيكل السوق الديناميكي لنقاط التحول
· 🧱 كتلة الأوامر
· ⚖️ اختلال السوق
· ⛓️ BOS & CHOCH
· 🧠 قوة ICT 3
_______________________________________________
🔚 أنظمة الخروج الذكية
_______________________________________________
📐 مؤشرات ZigZag
· ➖ ZigZag
_______________________________________________
🧱 مؤشرات الدعم والمقاومة
· 🟩 خطوط دعم ومقاومة SmartTrend
· 🧱 جميع مستويات الدعم والمقاومة
_______________________________________________
📊 مؤشرات الاتجاه والقناة
· 📊 Supertrend
· ⭐ قناة SSL المميزة
_______________________________________________
💧 أدوات الحجم والسيولة
· 📉 خريطة تصفية الرافعة المالية
_______________________________________________
⚡ مؤشرات الزخم وRSI
· 📈 مُشغل اتجاه RSI
· 🔎 متعقب تحيز الشمعة متعددة المستويات
Tracker
_______________________________________________
🔮 أدوات التنبؤ والإسقاط
· 📐 التنبؤ بناءً على Linreg& ATR
· 📏 انحدار فيبوناتشي الخطي متعدد الأطر الزمنية
· 📈 عارض تدفق السوق المدعوم بالحجم
🟢 تحديد كتل الأوامر 🔴
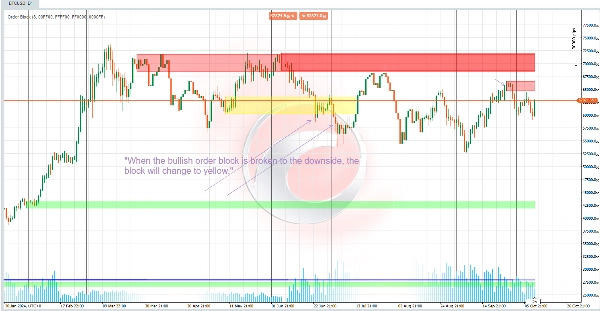
**كتلة أمر صاعدة 🚀:**
للكشف عن كتلة أمر صاعدة:
- يتحقق الكود مما إذا كان سعر الإغلاق الحالي يتجاوز أعلى نقطة في تأرجح سابق ⬆️.
- إذا كان كذلك ولم يتم عبور ذلك التأرجح بعد، يتم تمييزه كعبور. ثم تُعرف كتلة الأمر من أدنى إلى أعلى سعر في الشموع السابقة 📈.
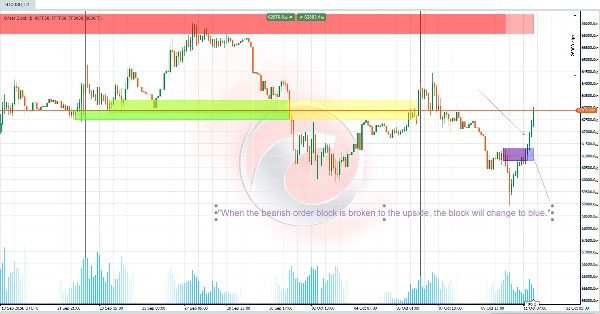
**كتلة أمر هابطة 🔻:**
- يعمل هذا بطريقة مماثلة لكنه ينطبق على تأرجحات السعر المنخفضة.
- يتم إنشاء كتلة أمر هابطة عندما ينخفض سعر الإغلاق الحالي تحت أدنى نقطة في تأرجح ⬇️.
### 💼 وظيفة كتلة الأمر 📊
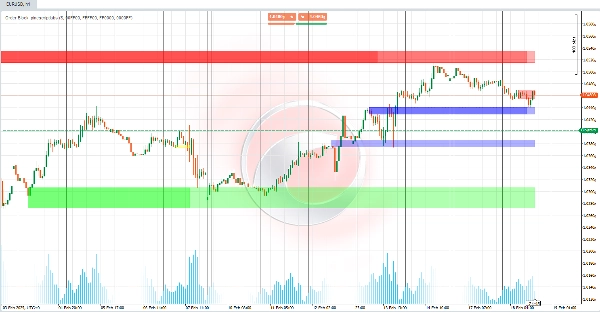
تمثل كتل الأوامر **مناطق تراكم عالية الحجم** حيث قد يكون اللاعبون الكبار في السوق قد تداولوا بشكل كبير
غالبًا ما تعمل هذه المناطق كمستويات دعم أو مقاومة محتملة ويمكن أن تشير إلى استمرار الاتجاه أو انعكاسه 📉📈.
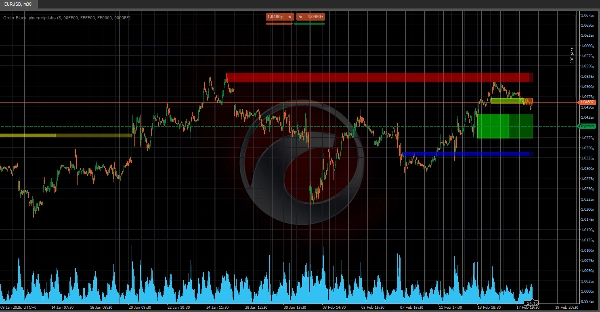
- **الدعم أو المقاومة:** قد تشير كتل الأوامر المكسورة إلى مناطق دعم أو مقاومة ذات صلة، اعتمادًا على الاتجاه السابق 🔄.
- **الاستمرار أو الانعكاس:**
- يمكن أن يشير كسر كتلة أمر في الاتجاه المعاكس إلى انعكاس محتمل 🔄.
- يمكن أن يؤكد الكسر في نفس الاتجاه استمرار الاتجاه 🔗.
هذا المؤشر قوي لتحديد **المستويات الرئيسية على الرسوم البيانية** 📈، مما يساعد المتداولين على تصور المناطق المهمة بناءً على سلوك السعر في مناطق الحجم العالي. مثالي لاكتشاف الاتجاهات وحركات السوق! 🎯📊
الملخص
تقييمات العملاء
5 | 100 % | |
4 | 0 % | |
3 | 0 % | |
2 | 0 % | |
1 | 0 % |


![شعار "[Hamster-Coder] Bollinger Bands"](https://cdn.ctrader.com/image/webp/21d8e5d6-fb11-4bac-b9ee-cd05c2b76804_30327)


