
الوصف
مؤشرات متجر Pinescriptlabs: روبوتات متجر Pinescriptlabs : (cBot) اختراق الذهب و BTCمحاور الجلسة(جديد)
هيكل السوق المتقدم: Bos, Choch, SwinLevels, كتل الأوامر، مكتشف هيكل السوق والسيولة (جديد)
خوارزمية ذكية متتبعة (جديد)
دعم ومقاومة SmartTrend
خطوط
Lines
تحليل
هيكل السوق الديناميكي
لـ
نقاط
الانعطاف
فيبوناتشي
انحدار خطي
متعدد الأطر الزمنية
Regression
متعدد المستويات
تتبع ميل الشمعة
المتعقب
دعم ومقاومة
اتجاه تلقائي
خطوط
Lines
جميع
مستويات الدعم والمقاومة
Levels
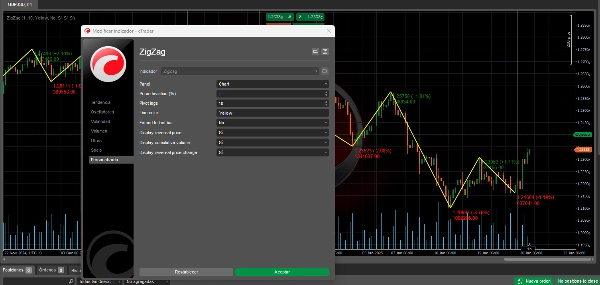
مؤشر ZigZag: تبسيط اتجاهات السوق 📉📈
ZigZag هو مؤشر فني يساعد في تحديد تغييرات الاتجاه المهمة في الأصل عن طريق تصفية تحركات السوق الصغيرة. الغرض الأساسي منه هو تبسيط تحليل السعر بصريًا من خلال إزالة "الضوضاء" الناتجة عن التقلبات الصغيرة.
كيف يعمل ⚙️
- 📊 يحلل الأسعار للعثور على نقاط انعطاف مهمة (محاور).
- 📈 تعتبر نقطة الانعطاف مهمة عندما يتغير السعر بنسبة مئوية دنيا محددة (معامل الانحراف).
- 🔗 يربط هذه النقاط بخطوط مستقيمة، مكونًا نمط "زيجزاج".
- 🕒 يتحدث ديناميكيًا مع ظهور بيانات سعر جديدة.
فائدة التداول 💡
تحديد الاتجاه 📐
- 🔍 يساعد في تصور الاتجاه الرئيسي للسوق.
- 🚀 يسهل اكتشاف الاتجاهات الصاعدة والهابطة.
- 📏 يبرز بوضوح مستويات الدعم والمقاومة الرئيسية.
تحليل الأنماط 📋
- 🎯 يبسط تحديد أنماط الرسم البياني.
- 🕵️♂️ يبرز تشكيلات السعر مثل المثلثات، الأعلام، وأنماط أخرى.
- 🌊 يعزز الوضوح عند التعرف على موجات إليوت.
إدارة التداول 🎛️
- 🎯 يحدد نقاط الدخول والخروج المحتملة.
- 🛡️ يساعد في تحديد مستويات وقف الخسارة بناءً على المحاور السابقة.
- 🎯 يسهل تحديد أهداف سعرية واقعية.
تحليل التقلبات 🌡️
- 📏 المسافة بين المحاور تعكس تقلبات السوق.
- 🧩 يساعد في تعديل الاستراتيجيات وفقًا لحجم التحركات.
- ⏳ يميز بين فترات التوحيد والاتجاهات الاتجاهية.
تأكيد الإشارة ✅
- 🔍 يعمل كأداة تأكيد لمؤشرات أخرى.
- 🚪 يؤكد اختراق المستويات الرئيسية.
- 🔗 يمكن دمجه مع مؤشرات أخرى لاستراتيجيات أكثر قوة.
الاعتبارات الرئيسية 🧠
إنه استرجاعي 📅
- ⏪ يتم تأكيد نقاط المحور فقط بعد حدوث الحركة.
- 🔮 ليس تنبؤيًا بمفرده.
- ⚖️ يجب استخدامه مع مؤشرات أخرى لاتخاذ القرار.
تعديلات المعاملات 🔧
- 🎚️ تعتمد الحساسية على نسبة الانحراف المحددة.
- 🔍 نسبة أصغر تظهر المزيد من نقاط المحور.
- 🧹 نسبة أعلى تصفي التحركات الصغيرة، مظهرة فقط التغييرات المهمة.
استخدام الإطار الزمني 🕒
- 🕰️ يعمل على أي إطار زمني.
- 🔄 يجب تعديل المعاملات بناءً على آفاق التداول.
- 🌐 التحليل عبر أطر زمنية متعددة يوفر رؤية أكثر شمولاً.
📈 استخدم مؤشر ZigZag كأداة قوية لتبسيط التحليل، وتحديد الاتجاهات، وتحسين اتخاذ القرار في رحلتك التداولية! 🚀
الملخص
Key functionalities include:
- Trend Identification: Visualizes primary market direction, highlights bullish and bearish trends, and marks key support and resistance levels.
- Pattern Analysis: Simplifies recognition of chart patterns such as triangles, flags, and Elliott waves.
- Trade Management: Assists in identifying entry and exit points, setting stop-loss levels based on previous pivots, and establishing realistic price targets.
- Volatility Analysis: Reflects market volatility through pivot distances, aiding strategy adjustments and distinguishing consolidation from trending phases.
- Signal Confirmation: Validates breakouts and complements other indicators for robust trading strategies.
The indicator is retrospective, confirming pivots only after price movements occur, and is not predictive on its own. Sensitivity can be adjusted via the deviation percentage to show more or fewer pivot points. It is compatible with any timeframe and benefits from multi-timeframe analysis for comprehensive market views.
This tool supports analysis across various markets including cryptocurrencies (BTCUSD), commodities (XAUUSD), and others, and integrates with related indicators like RSI, ATR, and Supertrend.
تقييمات العملاء
5 | 50 % | |
4 | 33 % | |
3 | 17 % | |
2 | 0 % | |
1 | 0 % |


