
الوصف
⚡ مرشح نطاق نيبولا Pro هو مؤشر ترند احترافي لمنصة cTrader يساعد المتداولين على تصفية ضوضاء السوق والتركيز فقط على التحركات ذات المعنى.
من خلال الجمع بين متوسط متحرك كخط أساس ومرشح نطاق تكيفي، يبرز نيبولا مراحل صعودية وهبوطية واضحة مع تجاهل التقلبات العشوائية.
هذا يجعله واحدًا من أكثر مؤشرات ترشيح الضوضاء فعالية لتداول الفوركس والمؤشرات والسلع والعملات المشفرة.
استكشف المزيد من الموارد والأسئلة المتكررة التفصيلية على AlgoXP
📊 كيف يعمل
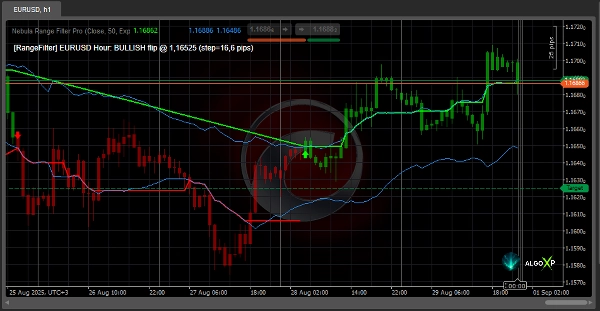
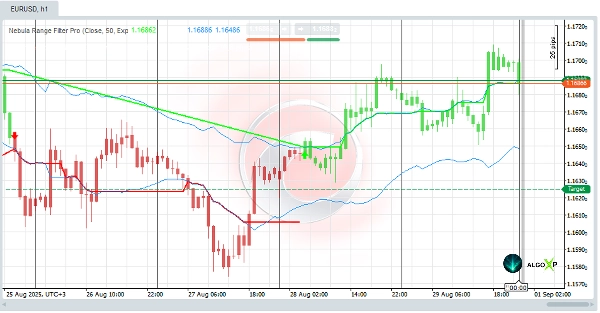
يبني المؤشر متوسطًا متحركًا كخط أساس ويحيط به بقناة ديناميكية. طالما بقي السعر داخل القناة، يظل الاتجاه دون تغيير.
بمجرد أن يخترق السعر القناة، يغير المؤشر الاتجاه ويلون لونه:
- الخط الأخضر = مرحلة صعودية (ميل للشراء)
- الخط الأحمر = مرحلة هبوطية (ميل للبيع)
بالإضافة إلى ذلك، يمكنك تلوين الشموع حسب الاتجاه — مما يجعل المخططات أكثر وضوحًا وأسهل للقراءة.
النتيجة: مخطط واضح مع إشارات اتجاه موثوقة وتنبيهات كاذبة أقل.
✅ الميزات الرئيسية
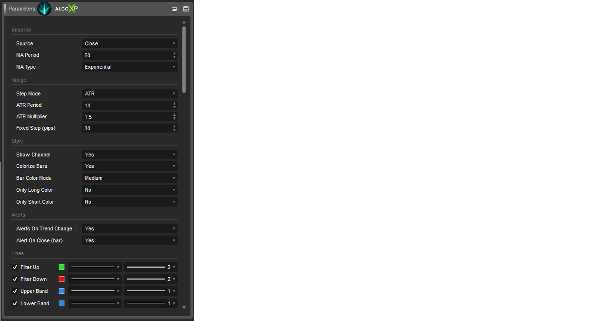
- ترشيح الاتجاه بناءً على متوسط متحرك مع نطاق ضوضاء.
- وضعان لحجم النطاق:
• ATR × مضاعف (تكيفي مع التقلب).
• نقاط ثابتة (حجم ثابت). - إشارات بصرية:
• الخط الأخضر = مرحلة صعودية.
• الخط الأحمر = مرحلة هبوطية. - عرض القناة الاختياري فوق وتحت خط الأساس.
- تلوين الأعمدة حسب الاتجاه بثلاثة أنماط: ساطع، متوسط، شفاف.
- خيارات منفصلة لتلوين الأعمدة الصعودية فقط أو الهبوطية فقط.
- تنبيهات تغير الاتجاه عند الانعكاسات (مع خيار التأكيد عند إغلاق العمود).
- علامات الانعكاس على المخطط (أسهم عند نقاط الانعكاس).
🎯 مثالي لـ
- المتداولين الذين يريدون مخططًا نظيفًا بدون ضوضاء.
- المتداولين السريعين على الأطر الزمنية القصيرة (M5–M15) لتصفية الإدخالات الخاطئة.
- المتداولين اليوميين الذين يستخدمون أنظمة تتبع الاتجاه للاختراق أو الارتداد.
- متداولي التأرجح الذين يريدون رؤية فقط تحولات الاتجاه الرئيسية.
- المتداولين الخوارزميين الذين يستخدمون انعكاسات المؤشر كإشارات دخول في cBots.
⚡ لماذا النسخة الاحترافية؟
- التحكم: التنبيهات والعلامات البصرية تساعد على التقاط الانعكاسات دون الحاجة للتركيز المستمر على الشاشة.
- الانضباط: يعرض فقط الانعكاسات المهمة، وليس كل تغير بسيط.
- المرونة: وضع ATR يتكيف مع تقلبات السوق، والوضع الثابت يحافظ على مرشح مستقر.
الوضوح: الخطوط الملونة، القنوات، وتظليل الأعمدة تجعل قراءة الاتجاه سهلة.
الملخص
Key features include two modes for setting the range size—an ATR-based adaptive mode and a fixed pips mode—visual trend signals, optional channel display, customizable bar coloring styles, separate options for coloring bullish or bearish bars, trend change alerts with confirmation options, and flip markers at reversal points.
The indicator supports multiple markets including Forex, indices, commodities, cryptocurrencies, and stocks. It is suitable for scalpers, intraday traders, swing traders, and algorithmic traders who rely on trend signals for entries. Nebula Range Filter Pro aims to provide a clear chart with reliable trend signals and reduced false alerts through its noise filtering approach.
تقييمات العملاء
5 | 100 % | |
4 | 0 % | |
3 | 0 % | |
2 | 0 % | |
1 | 0 % |


