
VegaXLR - Auto Support and Resistance
مؤشر
5 عمليات الشراء
الإصدار 1.0، Feb 2025
Windows, Mac
4.3
التقييمات: 3
الوصف
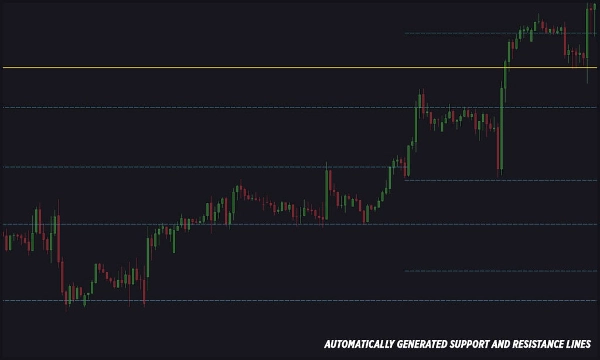
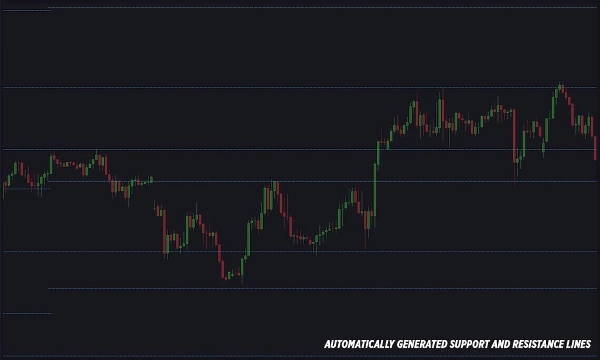
يقوم مؤشر cTrader هذا برسم خطوط الدعم والمقاومة تلقائيًا على الرسم البياني الخاص بك، مما يجعله سهل الاستخدام لكل من المبتدئين والمحترفين. يتم إنشاء الخطوط بناءً على مستويات فيبوناتشي الرئيسية وتقلبات السعر (الزجزاج).
الميزات:
- يكتشف ويرسم خطوط الدعم والمقاومة تلقائيًا.
- أنماط الخطوط، السماكة، والألوان قابلة للتخصيص بالكامل.
- عدد قابل للتعديل من خطوط الدعم والمقاومة.
- تنبيهات عند تفاعل السعر مع خطوط الدعم أو المقاومة.
- خيارات تنبيه متعددة: تيليجرام، البريد الإلكتروني، النوافذ المنبثقة، والأصوات.
- القدرة على اختيار مستويات فيبوناتشي التي تولد الخطوط.
- خيار لتفعيل التنبيهات من خطوط سعر العرض أو الطلب.
- شروط تنبيه قابلة للتكوين: تنبيهات إغلاق الشمعة أو تنبيهات لمس السعر الفوري.
- رسائل تنبيه قابلة للتخصيص مع تعليقات يحددها المستخدم.
- خيار لتمكين التنبيهات فقط لمستويات الدعم والمقاومة القوية.
- القدرة على التقاط وإرسال لقطات شاشة للرسم البياني عبر تيليجرام (يجب أن يكون الرسم البياني مرئيًا).
- إعداد تنبيه بريد إلكتروني بسيط.
- وصول سريع إلى دليل المستخدم من خلال زر صغير على الرسم البياني.
الملخص
ملخص الذكاء الاصطناعي
VegaXLR - Auto Support and Resistance is a cTrader indicator that automatically identifies and draws support and resistance lines on trading charts. It uses key Fibonacci levels combined with price swing analysis (zigzags) to generate these lines, aiding traders in recognizing critical price levels. The indicator offers full customization of line styles, thickness, and colors, and allows adjustment of the number of support and resistance lines displayed.
It features real-time alerts triggered when price interacts with these levels, with configurable conditions such as bar-close or instant price-touch alerts. Alert notifications can be sent via multiple channels including Telegram, Email, pop-ups, and sounds. Users can specify which Fibonacci levels to use for line generation and choose whether alerts trigger from Ask or Bid price lines. Additional options include enabling alerts only for strong levels, customizing alert messages, and capturing chart screenshots to send via Telegram.
A user guide is accessible directly from the chart for ease of use. This tool supports Forex markets and is designed to assist both beginners and professionals in technical analysis by automating the detection of key support and resistance zones.
ملف تعريف المؤشر
تقييمات العملاء
4.3
التقييمات: 3
5 | 67 % | |
4 | 0 % | |
3 | 33 % | |
2 | 0 % | |
1 | 0 % |
تقييمات العملاء
March 2, 2025
Focused trade layer if the trader wants it keeps attention on levels that actually matter. It works best as support, not a final decision maker. The cleanest use is 3 to 5 levels per chart, with 0.5 pullbacks checked before entry. not every zone holds, even if it looks clean.
March 1, 2025
March 1, 2025
Balanced demo helper for traders who build plans around market levels. It gives value around key price zones, but not every zone holds, even if it looks clean. I would wait for 2 reactions and avoid trades where the target is less than 1.5R. Levels are useful when they reduce noise, not when they crowd the chart.
مناقشة
الأسئلة الشائعة
Forex
يتم توفير المنتجات المتاحة من خلال cTrader Store، بما في ذلك روبوتات التداول والمؤشرات والإضافات، من قبل مطوري الطرف الثالث وإتاحتها لأغراض الوصول المعلوماتي والفني فقط. cTrader Store ليس وسيطًا ولا يقدم نصائح استثمارية أو توصيات شخصية أو أي ضمان للأداء المستقبلي.


![شعار "Gaussian Channel [Iridio Capital]"](https://cdn.ctrader.com/image/webp/7c039209-5573-4a54-a072-f9528b503103_41960)

السعر
215
المبيعات
680
التثبيتات المجانية