
ZigzagSR
مؤشر
5 عمليات الشراء
الإصدار 1.0، Jun 2025
Windows, Mac
4.3
التقييمات: 3
الوصف
ZigzagSR – تقلبات متعرجة ديناميكية مع دعم ومقاومة آليين
افتح هيكل السوق بشكل أوضح ومناطق دخول دقيقة مع ZigzagSR، مؤشر cTrader قوي يقوم بـ:
- رسم تقلبات متعرجة غير معادة الرسم (ارتفاعات أعلى، ارتفاعات أدنى، انخفاضات أعلى، انخفاضات أدنى) في الوقت الحقيقي
- يرسم تلقائيًا مستويات دعم ومقاومة ديناميكية بناءً على أحدث تقلبات المحور
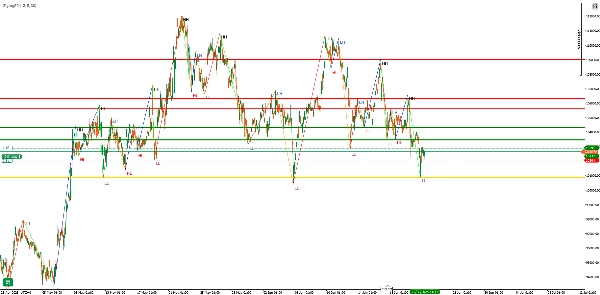
- يضع تسميات على كل نقطة تقلب ("HH"، "LH"، "HL"، "LL") لوضوح الاتجاه بنظرة سريعة
الميزات الرئيسية
- كشف متعرج تكيفي
-
- معلمات العمق، الانحراف، و الخطوة الخلفية قابلة للتكوين لضبط الحساسية لضوضاء السوق
- منطق غير معاد الرسم يضمن بقاء الإشارات التاريخية مستقرة بمجرد رسمها
- مستويات الدعم والمقاومة الآلية
-
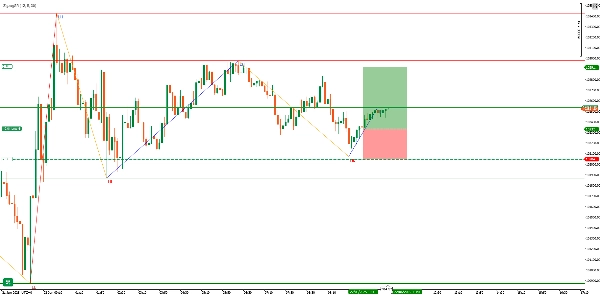
- يرسم خط المحور عند آخر نقطة تقلب صالحة (الخط الذهبي)
- يسلط الضوء على حتى آخر ثلاث قمم مقاومة (خطوط حمراء) وثلاثة قيعان دعم (خطوط خضراء) قبل المحور
- تتحدث الخطوط بسلاسة مع تشكل تقلبات جديدة، مما يحافظ على نظافة الرسم البياني الخاص بك
- تسميات بصرية واضحة
-
- "HH" (ارتفاع أعلى) و "LH" (ارتفاع أدنى) للقمم الهبوطية/الأعلى
- "HL" (انخفاض أعلى) و "LL" (انخفاض أدنى) للقيعان الصعودية/الأدنى
- أجزاء متعرجة ملونة:
-
- HH → أخضر ليموني
- LH → برتقالي
- HL → أزرق
- LL → أحمر
المدخلات والتخصيص
المعلمةالافتراضيالوصف
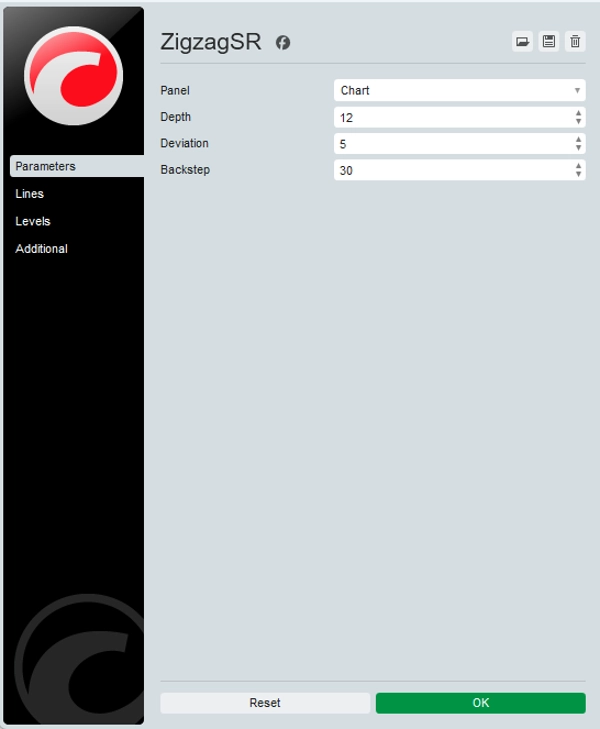
العمق
12
عدد الأشرطة للعودة للخلف لتحديد القمم/القيعان المحلية
الانحراف
5
أقل حركة سعرية (بالنقاط) لتُعتبر تقلبًا
الخطوة الخلفية
3
عدد الأشرطة لـ "إعادة التدوير" لقمع المحاور الخاطئة
نصيحة: زد العمق و الانحراف في الأطر الزمنية الأعلى لتصفية الضوضاء؛ وخفضهما في M1/M5 للحساسية.
لماذا تستخدم ZigzagSR؟
- تأكيد الاتجاه: تمييز واضح بين التقلبات الدافعة والحركات التصحيحية—مثالي لمتداولي التأرجح والانفجار.
- مناطق دخول الدعم والمقاومة: المستويات المحددة تلقائيًا تساعدك على تحديد مناطق الدخول، وقف الخسارة، وجني الأرباح دون الحاجة لرسم خطوط يدويًا.
- تطوير الاستراتيجية: التسميات والخطوط تغذي مباشرة أنظمة EAs/cBots أو الأنظمة اليدوية—ابنِ إعدادات متسقة وقائمة على قواعد.
كيف يعمل
- تعيين القمم/القيعان
-
- يفحص الأشرطة خلال آخر
Depthفترات لتحديد القمم والقيعان المحلية (_highMapو_lowMap).
- يفحص الأشرطة خلال آخر
- بناء التقلبات
-
- يتناوب بين الحالات الصعودية والهبوطية، مضيفًا فقط المحاور المهمة إلى قائمة التقلبات.
- تعيين التسميات
-
- يقارن كل محور مع السابق لوضع علامة HH/LH أو HL/LL.
- رسم الدعم والمقاومة
-
- يحدد أحدث محور كـ "خط المحور"، ثم يرسم الثلاثة قمم والقيعان الصالحة السابقة كمقاومة/دعم.
- رسم المتعرج
-
- يربط جميع نقاط التقلب بخطوط اتجاه ملونة ويضع تسميات نصية مع إزاحة طفيفة للوضوح.
حالات الاستخدام والنصائح
- تداول التأرجح: اركب الدوافع متعددة الأشرطة—ادخل عند التراجعات إلى خط المحور، واستهدف المستوى التالي للدعم والمقاومة.
- تأكيد الاختراق: انتظر حتى يخترق السعر خط مقاومة مرسوم بواسطة ZigzagSR، ثم أكد بالإشارة إلى الحجم أو RSI.
- التراكب مع مؤشرات أخرى: اجمع مع المتوسطات المتحركة، تباينات RSI، أو ملفات الحجم لتعزيز الإشارات.
ابدأ في ثوانٍ:
- قم بتثبيت ZigzagSR من متجر cTrader.
- اسحبه إلى أي رسم بياني—لا حاجة لمكتبات خارجية.
- اضبط المعلمات الثلاثة للمدخلات حسب الإطار الزمني المفضل وأسلوب الاستراتيجية.
ارتق بتحليل الرسم البياني الخاص بك مع هيكل التقلبات في الوقت الحقيقي والدعم والمقاومة الديناميكي—جرب ZigzagSR اليوم!
الملخص
ملف تعريف المؤشر
تقييمات العملاء
4.3
التقييمات: 3
5 | 33 % | |
4 | 67 % | |
3 | 0 % | |
2 | 0 % | |
1 | 0 % |
تقييمات العملاء
November 9, 2025
ZigzagSR combines classic wave mapping with auto S/R zones. Clean, responsive, and great for spotting turning points. A must-have for structure-focused traders. Could use alerts for new high/low formations, but performance and clarity are top-notch.
July 6, 2025
the review gets easier when it adds a check without pretending to know everything, and It needs a boring test before bigger size.
مناقشة
الأسئلة الشائعة
Breakout
Commodities
RSI
XAUUSD
يتم توفير المنتجات المتاحة من خلال cTrader Store، بما في ذلك روبوتات التداول والمؤشرات والإضافات، من قبل مطوري الطرف الثالث وإتاحتها لأغراض الوصول المعلوماتي والفني فقط. cTrader Store ليس وسيطًا ولا يقدم نصائح استثمارية أو توصيات شخصية أو أي ضمان للأداء المستقبلي.


![شعار "[Hamster-Coder] Pivot Points MTF"](https://cdn.ctrader.com/image/webp/4c143e5a-309c-40e3-a578-f04d1e133ffa_31159)


السعر
منذ 22/11/2024
133
المبيعات
2.58K
التثبيتات المجانية