
KANDIKA HEAT MAP
مؤشر
1 عمليات الشراء
الإصدار 1.0، Jul 2025
Windows, Mac
4.6
التقييمات: 3
🎨 منطق اللون – ماذا يخبرك
- 🟩 أخضر لايم → تحول الاتجاه صعودًا
يتشكل تغير زخم صعودي. استخدمه لاقتناص الصعود المبكر. - 🟥 قرمزي → تحول الاتجاه هبوطًا
يشير إلى تزايد الضغط الهبوطي. يجهزك لاحتمال الدخول في مراكز بيع أو الخروج. - 🟧/🔴 برتقالي/أحمر → منطقة تقلبات عالية
توقع ارتفاعات سعرية، تحركات سريعة، وفخاخ محتملة. ليست مكانًا للمخاطرة بدون تأكيد استراتيجيتك. - 🟦 أزرق فولاذي → منطقة تقلبات منخفضة
السوق يتباطأ، ينضغط، أو يتحرك ضمن نطاق. غالبًا ما يهيئ فرص اختراق.
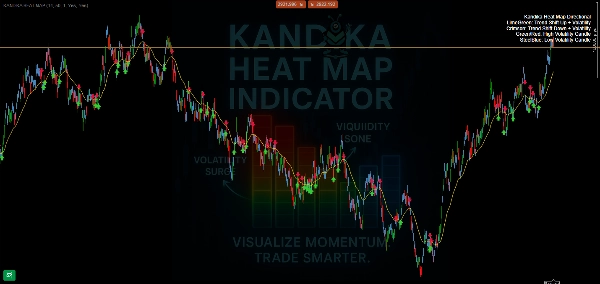
📊 ما يفعله (وما لا يفعله)
- ✅ يرسم بوضوح تغييرات اتجاه الاتجاه
- ✅ يفصل بصريًا بين المناطق الهادئة والمتقلبة
- ✅ طبقة بسيطة وملائمة للرسم البياني—بدون فوضى
ملف تعريف المؤشر
4.6
التقييمات: 3
5 | 67 % | |
4 | 33 % | |
3 | 0 % | |
2 | 0 % | |
1 | 0 % |
تقييمات العملاء
August 4, 2025
No reason to yolo this live without a few normal sessions, and Bad settings can ruin the idea.
July 26, 2025
20 percent less clicking is the line to watch. Market checks feel quicker.
يتم توفير المنتجات المتاحة من خلال cTrader Store، بما في ذلك روبوتات التداول والمؤشرات والإضافات، من قبل مطوري الطرف الثالث وإتاحتها لأغراض الوصول المعلوماتي والفني فقط. cTrader Store ليس وسيطًا ولا يقدم نصائح استثمارية أو توصيات شخصية أو أي ضمان للأداء المستقبلي.


منذ 08/06/2025
1
المبيعات