
Volume Meter
مؤشر
2 عمليات الشراء
الإصدار 1.0، Sep 2025
Windows, Mac
5.0
التقييمات: 1
الوصف
📘 ما الذي يفعله هذا المؤشر
- يعرض حجم التيك (عدد تغييرات السعر لكل شريط) على شكل مخطط بياني.
- في الفوركس، نادراً ما يقدم الوسطاء حجم التداول الحقيقي، لذلك يُستخدم حجم التيك كبديل.
- في الأسهم/العقود مقابل الفروقات/العقود الآجلة، قد تحصل على الحجم الحقيقي.
- يُظهر فوقه المتوسط المتحرك للحجم (افتراضي 20 فترة).
- يعمل هذا كـ "خط أساس" لتحديد بسرعة ما إذا كان حجم الشريط الحالي مرتفعًا أو منخفضًا بشكل غير معتاد.
🎯 كيفية الاستخدام كوسيلة تأكيد
المؤشر ليس مولد إشارة مستقل. بدلاً من ذلك، يستخدمه المتداولون لتأكيد الإعدادات من استراتيجيات أخرى:
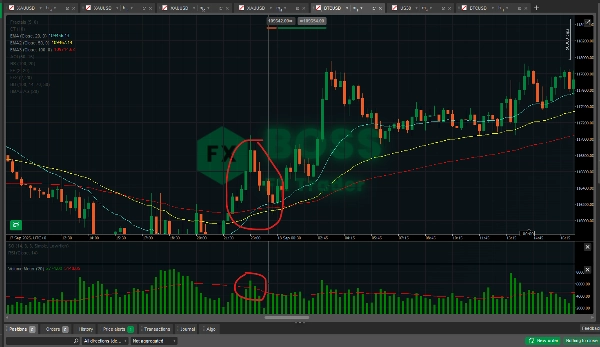
- تأكيد الاختراق
-
- إذا اخترق السعر فوق المقاومة أو تحت الدعم، تحقق مما إذا كانت شمعة الاختراق تحتوي على حجم أعلى من المتوسط المتحرك الخاص بها.
- الحجم العالي يؤكد وجود المزيد من المشاركين وراء الحركة → الاختراق أكثر موثوقية.
- اختراق بحجم منخفض = احتمال أعلى لحدوث اختراق كاذب.
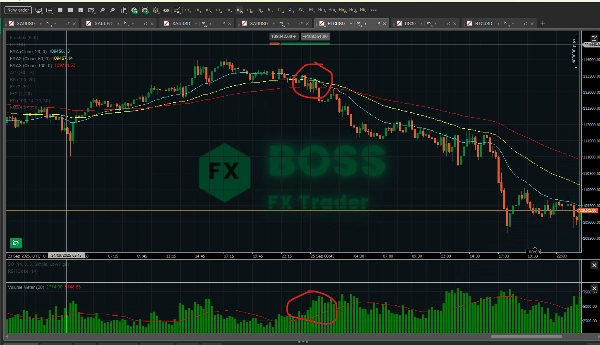
- استمرار الاتجاه مقابل النفاد
-
- في اتجاه قوي، غالبًا ما تكون شموع التراجع ذات حجم أقل مقارنة بشموع الدفع.
- إذا حدث تراجع بحجم منخفض واستأنفت الحركة التالية بحجم أعلى → يؤكد استمرار الاتجاه.
- إذا رأيت استمرار دفع الاتجاه ولكن الحجم ينخفض مع كل دفعة → احتمال النفاد، استعد للانعكاس.
- تأكيد الانعكاس
-
- شموع الانعكاس الكبيرة (شموع الدبوس، الشموع المحيطة، الفراكتلات) تكون أقوى إذا دعمتها قفزة في الحجم.
- مثال: شمعة دبوس صاعدة عند الدعم بحجم مرتفع = إشارة انعكاس أقوى من نفس شمعة الدبوس بحجم منخفض.
- مرشح الإشارات الكاذبة
-
- إذا أعطى نظامك الرئيسي إشارة شراء/بيع، لكن الحجم ضعيف (أقل من المتوسط)، قد تختار عدم الدخول في تلك الصفقة.
- يساعد في تقليل التداول المفرط وتصفيه الضوضاء.
📊 الفعالية
- في الفوركس: أظهر حجم التيك ارتباطًا قويًا مع حجم التداول الحقيقي (70–90% ارتباط في العديد من الدراسات). لذا فهو مفيد، لكنه ليس مثاليًا.
- في الأسهم/العقود الآجلة/العقود مقابل الفروقات: الحجم الحقيقي يجعل هذا أكثر قوة لأنك تقيس العقود/الأسهم المتداولة فعليًا.
- كوسيلة تأكيد: من الأفضل استخدامه مع حركة السعر ومؤشرات أخرى (مثل EMA، RSI، الفراكتلات). الاعتماد على الحجم فقط محفوف بالمخاطر.
- نقاط القوة: يؤكد الاختراقات، يصفّي الحركات الكاذبة، يكتشف النفاد.
- نقاط الضعف: لا يتنبأ بالاتجاه بمفرده — يضيف فقط ثقة بمجرد وجود إعداد.
✅ نصيحة عملية:
استخدم المؤشر كـ مرشح، وليس كمحفز. على سبيل المثال:
- ترى تقاطع EMA (إشارة شراء).
- تحقق: هل الحجم فوق المتوسط المتحرك الخاص به؟ إذا نعم → قم بالتداول. إذا لا → انتظر.
بهذه الطريقة تتداول فقط عندما يكون الزخم مدعومًا بمشاركة السوق.
الملخص
ملخص الذكاء الاصطناعي
Volume Meter is a trading indicator that displays tick volume—the number of price changes per bar—as a histogram. In Forex markets, where real traded volume data is often unavailable, tick volume serves as a proxy, while in stocks, CFDs, and futures, real volume data may be used. The indicator overlays a moving average of volume (default 20-period) to provide a baseline, helping traders identify whether current volume is unusually high or low.
This tool is designed to confirm trading setups rather than generate standalone signals. It assists in validating breakouts by checking if breakout candles have volume above their moving average, indicating stronger market participation. It also helps distinguish trend continuation from exhaustion by comparing volume levels during pullbacks and impulse moves. Additionally, it supports reversal confirmation by highlighting volume spikes on significant reversal candles and filters false signals by advising caution when volume is weak despite buy or sell signals from other systems.
Volume Meter is applicable across various markets including Forex, stocks, indices, commodities, and cryptocurrencies. Its effectiveness is enhanced when combined with price action and other indicators such as EMA or RSI. The indicator aids in improving trade decision confidence by integrating volume analysis as a confirmation and filtering tool.
ملف تعريف المؤشر
تقييمات العملاء
5.0
التقييمات: 1
5 | 100 % | |
4 | 0 % | |
3 | 0 % | |
2 | 0 % | |
1 | 0 % |
تقييمات العملاء
October 1, 2025
the first 10 trades should stay boring, and the checklist becomes easier to follow.
مناقشة
الأسئلة الشائعة
BTCUSD
Forex
Breakout
Indices
EURUSD
Commodities
GBPUSD
NZDUSD
Prop
Supertrend
Crypto
Stocks
XAUUSD
NAS100
USDJPY
يتم توفير المنتجات المتاحة من خلال cTrader Store، بما في ذلك روبوتات التداول والمؤشرات والإضافات، من قبل مطوري الطرف الثالث وإتاحتها لأغراض الوصول المعلوماتي والفني فقط. cTrader Store ليس وسيطًا ولا يقدم نصائح استثمارية أو توصيات شخصية أو أي ضمان للأداء المستقبلي.


السعر
منذ 29/05/2025
3.04M
حجم التداول
45.22K
الربح بالبيب
29
المبيعات
768
التثبيتات المجانية