
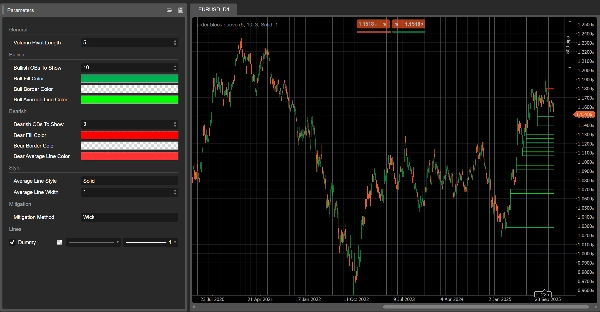
Descrizione
Ordine Cluster di Liquidità (LCO) 🔍💧
1. Cosa mostra LCO
Ordine Cluster di Liquidità rileva automaticamente e disegna:
- Cluster di liquidità rialzisti (potenziali zone di domanda / accumulo) ✅
- Cluster di liquidità ribassisti (potenziali zone di offerta / distribuzione) 🔻
Ogni cluster è:
- ancorato a una barra pivot di volume (un massimo locale di volume),
- classificato come rialzista o ribassista in base all'estensione recente del prezzo,
- esteso in avanti nel tempo fino a quando il prezzo mitiga (consuma) il cluster.
Sul grafico vedi:
- Rettangoli verdi → cluster di liquidità rialzisti
- Rettangoli rossi → cluster di liquidità ribassisti
- Una linea grigia all'interno di ogni rettangolo → il livello medio di prezzo di quel cluster
Una volta che un cluster è considerato mitigato, scompare dal grafico e rimangono solo i cluster attivi.
2. Logica di rilevamento (in termini semplici)
- Pivot di volume
-
- LCO scansiona le barre dove il volume è più alto rispetto alle barre precedenti e successive di
Volume Pivot Length. - Queste barre sono pivot di volume – potenziali ancore per i cluster di liquidità.
- LCO scansiona le barre dove il volume è più alto rispetto alle barre precedenti e successive di
- Contesto: rialzista vs ribassista
-
- Il comportamento recente del prezzo definisce un contesto:
-
- Contesto rialzista → ha dominato l'estensione al ribasso.
- Contesto ribassista → ha dominato l'estensione al rialzo.
- Questo contesto decide se il prossimo pivot di volume creerà un cluster rialzista o cluster ribassista di liquidità.
- Cluster di liquidità rialzista
In un contesto rialzista: -
- Fondo del cluster = minimo della barra pivot
- Parte superiore del cluster = punto medio della barra (
(alto + basso) / 2) - Interpretazione: zona dove la pressione al ribasso è stata assorbita e gli acquirenti sono intervenuti con decisione.
- Cluster di liquidità ribassista
In un contesto ribassista: -
- Fondo del cluster = punto medio della barra pivot
- Parte superiore del cluster = massimo della barra pivot
- Interpretazione: zona dove la pressione al rialzo è stata assorbita e i venditori hanno preso il controllo.
- Linea media
-
- Per ogni cluster, LCO calcola la media tra la parte superiore e inferiore e disegna una linea mediana grigia.
- Questa funge da livello di equilibrio interno del cluster.
- Mitigazione (consumo del cluster)
Ad ogni nuova barra, LCO verifica se un cluster è mitigato: -
- Per i cluster rialzisti:
-
- Tiene traccia di un prezzo target al ribasso negli ultimi
Volume Pivot Lengthbarre: -
Metodo di mitigazione = Wick→ minimo low.Metodo di mitigazione = Close→ minimo close.
- Se questo prezzo target scende sotto il fondo del cluster, il cluster rialzista è considerato mitigato e rimosso.
- Tiene traccia di un prezzo target al ribasso negli ultimi
- Per i cluster ribassisti:
-
- Tiene traccia di un prezzo target al rialzo:
-
Wick→ massimo high.Close→ massimo close.
- Se questo prezzo target sale sopra la parte superiore del cluster, il cluster ribassista è mitigato e rimosso.
Mitigato = la liquidità in quel cluster si presume consumata / invalidata.
3. Come leggere LCO sul grafico
Vedrai principalmente:
- Cluster verdi sotto il prezzo → potenziali zone di liquidità di domanda
- Cluster rossi sopra il prezzo → potenziali zone di liquidità di offerta
Lettura tipica (non un consiglio di trading):
- Cluster freschi
-
- I cluster creati di recente sono spesso più rilevanti:
-
- Cluster rialzista sotto il prezzo → area dove gli acquirenti hanno assorbito per ultimi la pressione di vendita.
- Cluster ribassista sopra il prezzo → area dove i venditori hanno assorbito per ultimi la pressione di acquisto.
- Ritest dei cluster
-
- Il prezzo ritorna a un cluster rialzista dall'alto:
-
- Se il prezzo reagisce e mantiene il fondo → possibile rimbalzo / zona di reazione long.
- Il prezzo ritorna a un cluster ribassista dal basso:
-
- Se il prezzo non riesce a superare la parte superiore → possibile respingimento / zona di reazione short.
- Cluster mitigati vs attivi
-
- Quando il prezzo attraversa un cluster oltre i suoi confini secondo il metodo di mitigazione scelto,
→ quel cluster di liquidità viene rimosso nelle barre successive. - I cluster ancora visibili sono zone di liquidità attive non ancora completamente attraversate dal prezzo.
- Quando il prezzo attraversa un cluster oltre i suoi confini secondo il metodo di mitigazione scelto,
- Uso della linea mediana
-
- Quella linea mediana grigia può essere usata come:
-
- livello di presa di profitto o uscita parziale all'interno del cluster,
- riferimento di “prezzo equo” all'interno della zona di liquidità,
- un modo rapido per vedere se il prezzo sta trattando nella metà superiore o inferiore del cluster.
4. Parametri (Inglese)
Lunghezza Pivot di Volume
- Barre usate per:
-
- rilevare i pivot di volume,
- calcolare estremi e target di mitigazione.
- Valori più bassi → più cluster, più rumore;
- Valori più alti → meno cluster, più significativi.
Cluster di Liquidità Rialzisti da Mostrare
(ex OB Rialzisti da Mostrare)
- Numero massimo di cluster rialzisti visualizzati sul grafico.
Cluster di Liquidità Ribassisti da Mostrare
(ex OB Ribassisti da Mostrare)
- Numero massimo di cluster ribassisti visualizzati.
Colore di Riempimento Bull / Colore di Riempimento Bear
- Colore di riempimento dei cluster rialzisti/ribassisti.
- Puoi includere valori alpha (opacità).
Colore Linea Media Bull/Bear
- Colore della linea mediana interna per ogni cluster.
Stile Linea Media
- Stile visivo per la linea mediana:
"Solido","Tratteggiato","Punteggiato".
Spessore Linea Media
- Spessore della linea mediana.
Metodo di Mitigazione
"Wick"→ mitigazione basata su ombre alte/basse (più sensibile)."Close"→ mitigazione basata su prezzi di chiusura (più conservativa).
Riepilogo
On the chart, bullish clusters appear as green rectangles below the price, indicating areas where buyers absorbed selling pressure. Bearish clusters are shown as red rectangles above the price, marking zones where sellers absorbed buying pressure. Each cluster includes a grey mid-line representing the average price level, serving as an internal equilibrium reference.
Clusters extend forward in time until price "mitigates" or consumes them, at which point they disappear, leaving only active liquidity zones visible. Mitigation is determined by tracking price extremes (high/low wicks or closing prices) over a configurable number of bars.
Key parameters include the volume pivot length (defining sensitivity and cluster significance), maximum clusters displayed, cluster colors, mid-line style, and mitigation method. LCO supports various markets including forex, indices, commodities, stocks, and cryptocurrencies, and integrates with multiple trading strategies and indicators such as RSI, MACD, Bollinger Bands, and Fibonacci levels.
Recensioni dei clienti
5 | 100 % | |
4 | 0 % | |
3 | 0 % | |
2 | 0 % | |
1 | 0 % |


![Logo di "[Stellar Strategies] MARSI Signal Plotter"](https://cdn.ctrader.com/image/webp/7b2b8da6-8f8e-4646-8d4a-4710c516c01e_25567)


![Logo di "High-Low Divergence [Iridio Capital]"](https://cdn.ctrader.com/image/webp/443c4661-7abb-40f1-842f-4b6ec560649b_40914)

