Descrizione
Pitch del Marketplace (breve)
Volume Delta & CVD — Leggi il flusso aggressivo in tempo reale. Reset flessibili (Giorno/Settimana/Mese), levigatura EMA opzionale e delta cumulativo non ridipinto. Perfetto per confermare breakout e individuare divergenze.
Volume Delta & CVD — Guida alla revisione e ai parametri
Slogan: Misura lo squilibrio tra acquisto/vendita (Delta) e il suo flusso cumulativo (CVD) con reset flessibili. Non ridipinto.
Panoramica
Volume Delta & CVD per cTrader calcola, per barra, il Delta (acquisti aggressivi vs vendite) e il CVD (Delta Volume Cumulativo). Ti aiuta a leggere la pressione del flusso ordini, confermare breakout e individuare divergenze rispetto al prezzo.
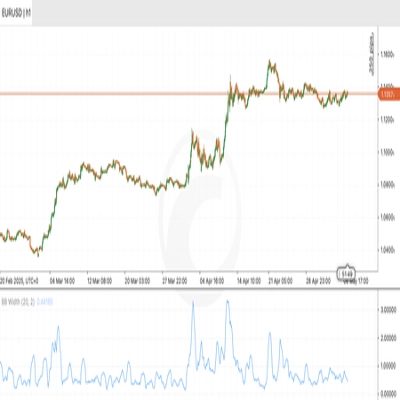
Nota: L'indicatore utilizza TickVolume (standard cTrader) come proxy del volume.
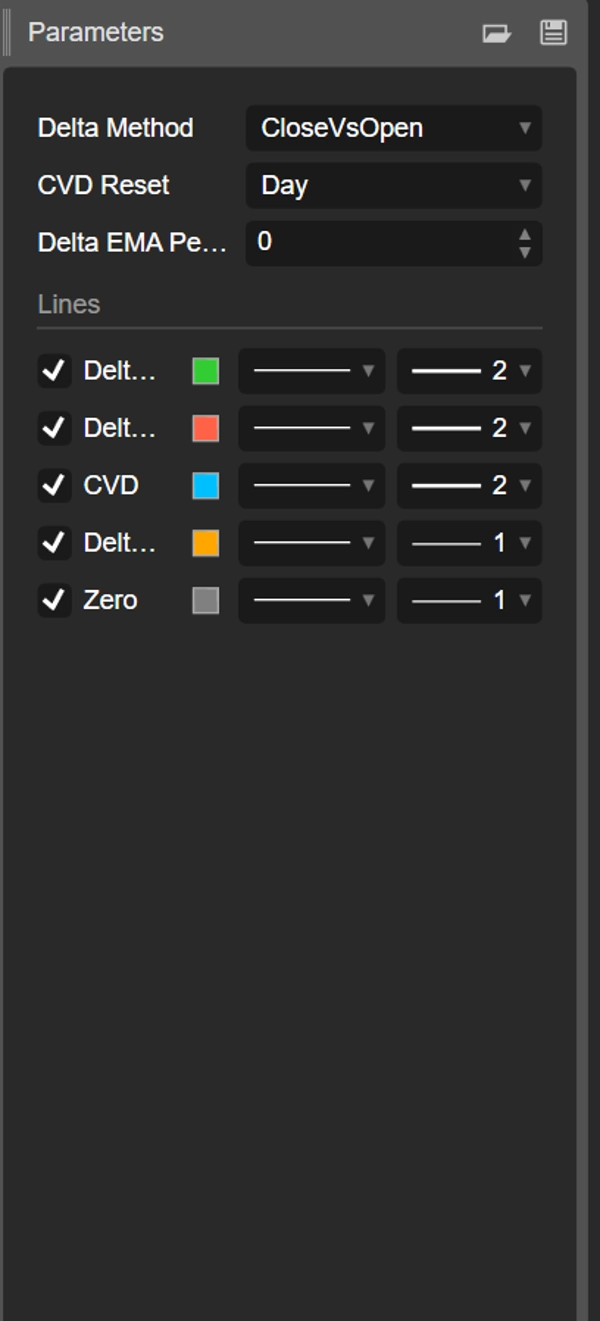
Parametri (dettagliati)
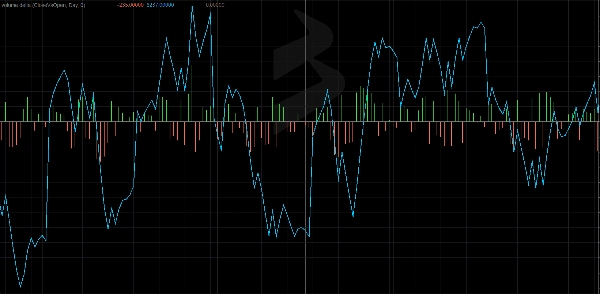
Metodo Delta
Scegli come viene stimato il flusso direzionale della barra:
- CloseVsPrevClose
Delta = ±TickVolume a seconda di Close[t] vs Close[t-1].
Vantaggi: molto reattivo; ottimo per cambi di regime intraday. - CloseVsOpen
Delta = ±TickVolume a seconda di Close vs Open della stessa barra.
Vantaggi: evidenzia barre direzionali; riduce il rumore tra barre. - Moltiplicatore del flusso di denaro (MFM)
MFM = ((Close−Low) − (High−Close)) / (High−Low)in [−1, +1]
Delta = MFM × TickVolume
Vantaggi: ponderazione intra-barra; fluido/robusto quando gli intervalli sono ampi.
Reset CVD
Controlla quando il contatore cumulativo si riavvia:
- Nessuno: continuo dall'inizio del grafico.
- Giorno: reset ad ogni nuovo giorno (bias intraday).
- Settimana: reset ad ogni nuova settimana (swing).
- Mese: reset ad ogni nuovo mese (bias a timeframe superiore).
Periodo EMA Delta (0 = disattivato)
- Applica una EMA al Delta per levigare l'istogramma e rivelare cambi di regime.
- Suggerimenti: 5–9 scalping, 10–21 intraday, 21–34 swing.
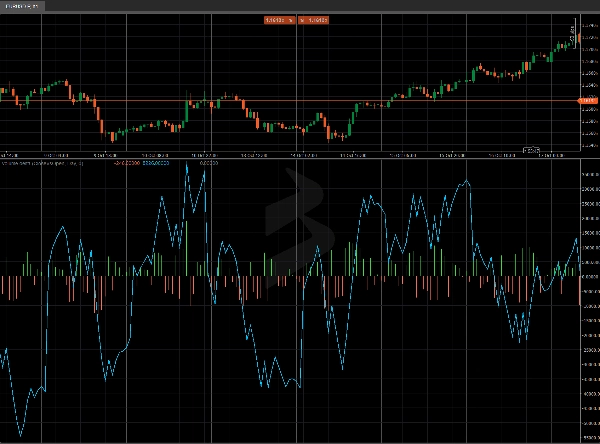
Output / Buffer
- Delta Up (istogramma verde): porzione positiva di Delta.
- Delta Down (istogramma rosso): porzione negativa di Delta.
- CVD (linea acqua): somma cumulativa di Delta con il reset scelto.
- Delta EMA (linea arancione, opzionale): Delta levigato.
- Zero (linea grigia): linea base per un confronto rapido.
Come leggerlo
- Delta > 0 → predominanza di acquisti aggressivi nella barra.
- Delta < 0 → predominanza di vendite aggressive nella barra.
- CVD in aumento → accumulo; CVD in calo → distribuzione.
- Divergenze
-
- Il prezzo fa massimi più alti mentre il CVD non conferma → possibile esaurimento della pressione d'acquisto.
- Il prezzo fa minimi più bassi mentre il CVD non conferma → possibile esaurimento della pressione di vendita.
Playbook pratici
- Conferma del breakout: preferisci breakout long quando il CVD accelera e Delta EMA diventa positivo.
- Ritracciamenti delle estensioni: cerca divergenze prezzo vs CVD a livelli chiave (VWAP/VWAP ancorato, S/R).
- Bias di sessione: con Reset CVD = Giorno, leggi la direzione intraday dominante.
Avvio rapido
- Allega l'indicatore.
- Inizia con Metodo Delta = MFM, Reset CVD = Giorno, EMA = 10 (intraday).
- Su grafici rumorosi, aumenta EMA o passa a CloseVsOpen.
- Cerca congiunzioni con Anchored VWAP, S/R statici/dinamici o pattern di price action.
Prestazioni e compatibilità
- API moderne (
Bars.*,LineColor). - Calcoli non ridipinti.
- Funziona su qualsiasi simbolo e timeframe.
Riepilogo
The indicator supports three Delta calculation methods: CloseVsPrevClose (responsive for intraday shifts), CloseVsOpen (reduces noise by focusing on directional bars), and Money Flow Multiplier (MFM) which weights intra-bar volume for smoother results. An optional Exponential Moving Average (EMA) smoothing can be applied to Delta to highlight regime changes.
Outputs include separate histograms for positive and negative Delta, the CVD line, an optional Delta EMA line, and a zero baseline for reference. Traders can use the indicator to confirm breakouts, identify divergences between price and volume flow, and assess order-flow pressure. It works on any symbol and timeframe, supporting markets such as Forex, indices, commodities, stocks, and cryptocurrencies.