
คำอธิบาย
ตัวบ่งชี้ช่องว่างมูลค่ายุติธรรม
ภาพรวม
ตัวบ่งชี้ช่องว่างมูลค่ายุติธรรมเป็นเครื่องมือที่แม่นยำสำหรับผู้ซื้อขายที่ใช้การเคลื่อนไหวของราคาเพื่อระบุ ติดตาม และตรวจสอบความไม่สมดุลของตลาดระยะสั้น โดยจะตรวจจับช่องว่างมูลค่ายุติธรรม (FVGs) ทั้งแบบขาขึ้นและขาลงโดยอัตโนมัติ เน้นโซนที่ยังไม่ถูกแก้ไข (ยังไม่บรรเทา) บนแผนภูมิของคุณ และบันทึกเมื่อราคากลับมาเติมเต็ม (บรรเทา) โซนเหล่านั้น ตัวบ่งชี้นี้มีน้ำหนักเบาและไม่ทำการวาดซ้ำ (ทำงานบนแท่งที่ปิดแล้ว) ออกแบบมาเพื่อการวิเคราะห์ที่เชื่อถือได้ในการซื้อขายสดและการทดสอบย้อนหลัง
คุณสมบัติหลัก
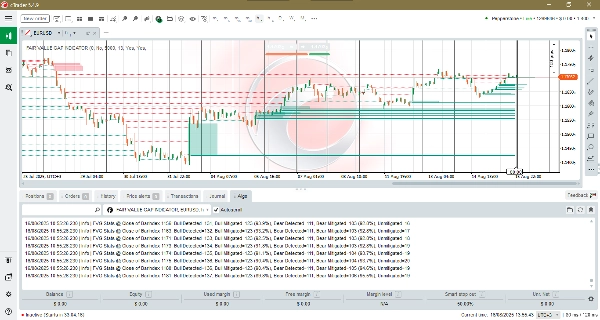
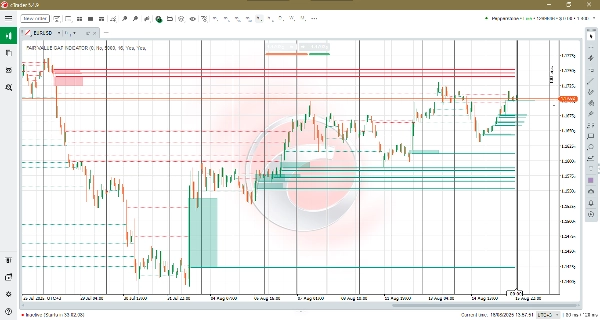
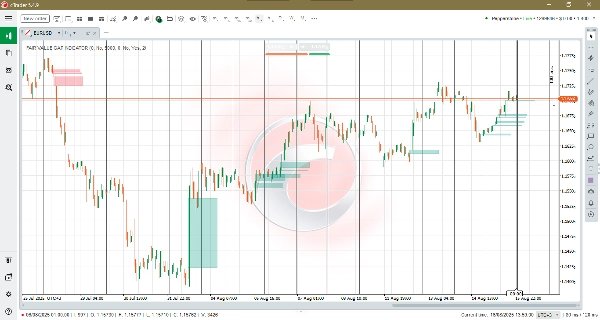
- การตรวจจับ FVG อัตโนมัติ: ตรรกะ 3 แท่งที่แข็งแกร่งระบุทั้งโซนความไม่สมดุลแบบขาขึ้นและขาลง และวาดโซนสี่เหลี่ยมที่ชัดเจนบนแผนภูมิ
- การติดตามการบรรเทา: เมื่อราคาปิดผ่านโซน ตัวบ่งชี้จะลบกล่องออกและสามารถวาดเส้นบรรเทาแบบจุดที่คงที่เพื่ออ้างอิงในอดีต
- การซ้อนทับระดับที่ยังไม่บรรเทา: แสดงระดับที่ยังไม่เติมเต็มล่าสุด N ระดับเป็นเส้นแนวนอนหนาที่วาดจากแท่งที่ตรวจจับถึงแท่งที่กำลังสร้างอยู่ ทำให้ง่ายต่อการสแกนด้วยสายตาเพื่อดูช่องว่างมูลค่ายุติธรรมที่ยังไม่บรรเทาและระบุระดับราคาของพวกมันอย่างรวดเร็ว
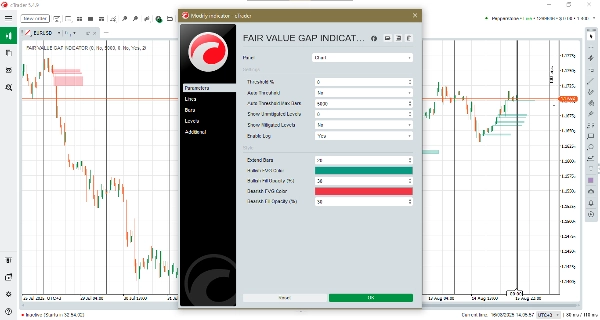
- การตั้งเกณฑ์ด้วยตนเองและอัตโนมัติ: เลือกเกณฑ์สัมพัทธ์คงที่หรือเปิดใช้งานเกณฑ์อัตโนมัติเพื่อให้ตัวบ่งชี้ปรับตัวเข้ากับกิจกรรมตลาดล่าสุด
- จำนวนแท่งสูงสุดสำหรับเกณฑ์อัตโนมัติ: ควบคุมขนาดหน้าต่างเลื่อนที่ใช้ในการคำนวณเกณฑ์อัตโนมัติ ค่าที่มากกว่าจะทำให้เกณฑ์เรียบขึ้น (เสถียรในประวัติศาสตร์ที่ยาวขึ้น) ค่าน้อยกว่าจะทำให้ตอบสนองต่อความผันผวนล่าสุดได้ดีขึ้น
- ภาพและการฉายภาพที่กำหนดเอง: ตั้งค่าความยาวการขยาย (ระยะที่กล่องฉายออกไป) สี และความทึบแสงของการเติมสำหรับโซนขาขึ้นและขาลงให้ตรงกับสไตล์แผนภูมิของคุณ
- การบันทึกในเทอร์มินัล: บรรทัดบันทึกที่กะทัดรัดรายงานจำนวน FVG ที่ตรวจจับได้ทั้งหมด การบรรเทา และจำนวนที่ยังไม่บรรเทาปัจจุบัน—เหมาะสำหรับการตรวจสอบและปรับแต่งกลยุทธ์
- ตรรกะแท่งที่ปิดแล้ว: ออกแบบให้ทำงานครั้งละหนึ่งแท่งที่ปิดแล้วเพื่อลดการวาดซ้ำ
ประโยชน์
- การอ้างอิงการซื้อขายที่ชัดเจน: ค้นหาโซนความไม่สมดุลที่อาจทำหน้าที่เป็นเป้าหมายการกลับตัว พื้นที่ปฏิกิริยา หรือการอ้างอิงการจัดการการซื้อขายได้อย่างรวดเร็ว
- การตรวจสอบและสถิติ: ใช้บันทึกในเทอร์มินัลและเปอร์เซ็นต์การบรรเทาเพื่อตรวจสอบสัญญาณและปรับความไวสำหรับกลยุทธ์ของคุณ
- ความไวที่ปรับตัวได้: การตั้งเกณฑ์อัตโนมัติ + จำนวนแท่งสูงสุดช่วยให้ตัวบ่งชี้ทำงานได้อย่างน่าเชื่อถือในตลาดที่เงียบและผันผวนโดยไม่ต้องปรับแต่งด้วยตนเองบ่อยๆ
- ภาพที่กะทัดรัดและไม่รบกวน: รอยเท้าภาพที่น้อยที่สุดช่วยให้แผนภูมิของคุณอ่านง่ายในขณะที่ยังคงรักษาบริบทที่จำเป็นไว้
เหมาะสำหรับ
ผู้ซื้อขายรายวัน ผู้ซื้อขายสวิง และสแคลเปอร์ที่พึ่งพาการเคลื่อนไหวของราคาและแนวคิดความไม่สมดุล รวมถึงนักวิเคราะห์ที่ตรวจสอบปฏิกิริยาโฟลว์คำสั่งและประสิทธิภาพกลยุทธ์
บทสรุป
ตัวบ่งชี้ช่องว่างมูลค่ายุติธรรมรวมการตรวจจับความไม่สมดุลที่แม่นยำกับการวิเคราะห์การบรรเทาและการตั้งเกณฑ์ที่ปรับตัวได้ ให้มุมมองที่เน้นและมีเสียงรบกวนน้อยของความไม่สมดุลในตลาด ใช้มันเพื่อค้นหาการกลับตัวของราคาอย่างมีศักยภาพ จัดการการซื้อขายอย่างชาญฉลาดขึ้น และวัดความถี่ที่โซนถูกเติมในตลาดของคุณ
สรุป
Key features include automated FVG detection, mitigation tracking, and an overlay showing recent unmitigated levels as bold horizontal lines for easy visual scanning. Users can select manual or automatic thresholding to adapt sensitivity to market conditions, with adjustable parameters controlling the responsiveness of the auto threshold. Customizable visual settings allow traders to tailor the appearance of bullish and bearish zones.
The indicator operates on closed bars to minimize repainting, ensuring reliable signals for live trading and backtesting. Terminal logging provides concise statistics on detected gaps and mitigations, aiding validation and strategy tuning.
Suitable for day traders, swing traders, scalpers, and analysts, the Fair Value Gap Indicator supports markets including Forex, indices, commodities, cryptocurrencies, and stocks. It offers a focused, low-noise view of market imbalances to assist in identifying potential price return targets and managing trades.
รีวิวจากลูกค้า
5 | 100 % | |
4 | 0 % | |
3 | 0 % | |
2 | 0 % | |
1 | 0 % |


