
ictkillzonesfromnovem
Gösterge
1 satın almalar
Sürüm 1.0, May 2025
Windows, Mac
Açıklama
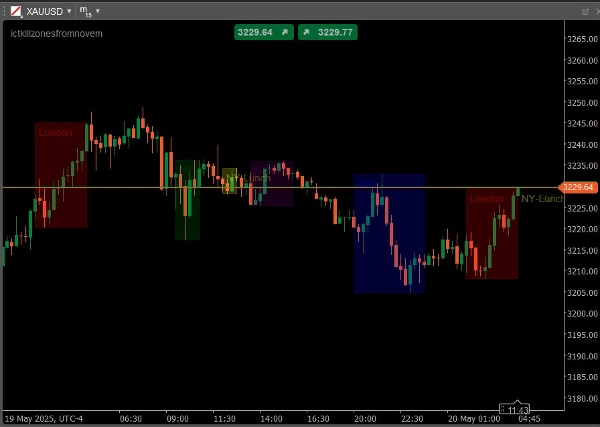
ICT TÜM KİLL BÖLGELERİ OTURUM YÜKSEKLERİ VE DÜŞÜKLERİ İLE, LONDRA, ASYA, NY AM, NY ÖĞLE, NY PM
Özet
YZ özeti
This indicator displays all ICT (Inner Circle Trader) kill zones along with session highs and lows for major trading sessions: London, Asia, New York AM, New York Lunch, and New York PM. It visually marks these key time zones and price levels on trading charts to assist traders in identifying important market activity periods and potential support or resistance areas based on session highs and lows. The indicator supports multiple global market sessions, providing a consolidated view of critical trading intervals within a single tool.
Gösterge profili
Müşteri değerlendirmeleri
0.0
Değerlendirmeler: 0
Müşteri değerlendirmeleri
Bu ürün için henüz bir değerlendirme yok. Ürünü denediniz mi? O zaman ona dair görüşlerini paylaşan ilk kişi olun!
Tartışma
SSS
cTrader Store üzerinden erişilebilen işlem botları, göstergeler ve eklentiler gibi ürünler, üçüncü taraf sağlayıcılar tarafından sağlanır ve yalnızca bilgilendirme ve teknik erişim amaçlarıyla sunulur. cTrader Store bir broker değildir ve yatırım tavsiyesi, kişisel öneriler vermez veya gelecekteki performansı garanti etmez.


Fiyat
Başlangıç 19/05/2025
1
Satışlar