
RT TradingView ATR
Gösterge
1 satın almalar
Sürüm 1.0, Sep 2024
Windows, Mac
Açıklama
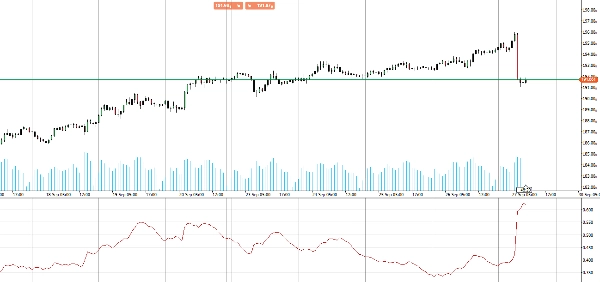
cTrader için TradingView’in Ortalama Gerçek Aralık hesaplamasının hassasiyetine uygun olarak tasarlanmış TradingView ATR göstergesini tanıtıyoruz.
Bu geliştirilmiş ATR, hesaplamalarında Göreceli Hareketli Ortalama (RMA) kullanır ve cTrader’daki varsayılan ATR’ye kıyasla piyasa volatilitesinin daha doğru bir yansımasını sağlar. RMA’yı dahil ederek, bu gösterge daha pürüzsüz ve daha duyarlı volatilite okumaları sunar, böylece daha bilinçli ticaret kararları vermenize yardımcı olur.
Teknik analizlerinde geliştirilmiş doğruluk arayan tüccarlar için mükemmel olan bu ATR göstergesi, ticaret stratejinizi yükseltmek için güçlü bir araçtır.
Kesin ve güvenilir volatilite içgörüleri için cTrader araç setinizi bu ATR göstergesi ile yükseltin.
Özet
Gösterge profili
Müşteri değerlendirmeleri
0.0
Değerlendirmeler: 0
Müşteri değerlendirmeleri
Bu ürün için henüz bir değerlendirme yok. Ürünü denediniz mi? O zaman ona dair görüşlerini paylaşan ilk kişi olun!
Tartışma
SSS
ATR
cTrader Store üzerinden erişilebilen işlem botları, göstergeler ve eklentiler gibi ürünler, üçüncü taraf sağlayıcılar tarafından sağlanır ve yalnızca bilgilendirme ve teknik erişim amaçlarıyla sunulur. cTrader Store bir broker değildir ve yatırım tavsiyesi, kişisel öneriler vermez veya gelecekteki performansı garanti etmez.


Fiyat
Başlangıç 25/09/2024
20
Satışlar