
Açıklama
QX Heatmap Scanner, saniyeler içinde birden fazla sembolü ve zaman dilimini taramanıza yardımcı olan kompakt, grafik üzerinde bir heatmap panelidir. Piyasa Yönünü, Gücü ve Volatiliteyi, en iyi koşulları önceliklendirmeniz ve düşük kaliteli düzenlerden kaçınmanız için hücre başına net bir puana özetler.
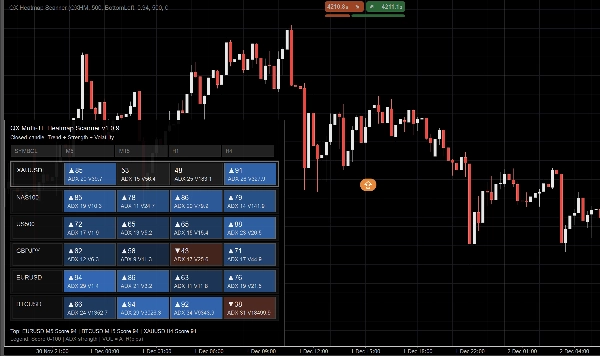
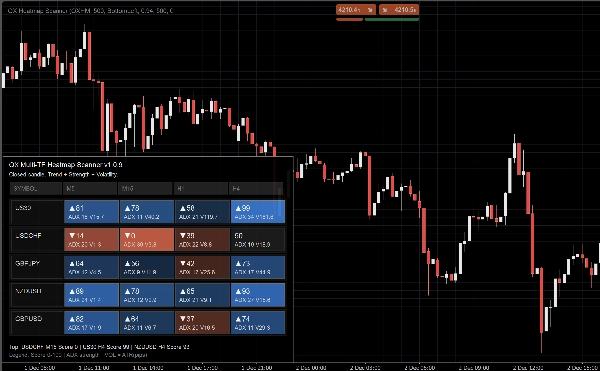
Gördükleriniz
Her hücre (Sembol × Zaman Dilimi) şunları gösterir:
- Puan (0–100) yön belirten işaretle (eğilimliyse ▲/▼)
- ADX değeri (güç bağlamı)
- VOL değeri (volatilite bağlamı)
Renk yoğunluğu inancı yansıtır. Düzen, birçok zaman dilimi olsa bile okunabilir kalır.
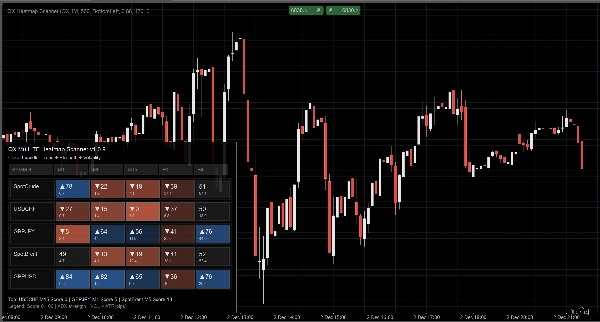
Görüntüleme modları
- Otomatik: mevcut hücre genişliğine uyum sağlar
- Tam: maksimum detay
- Kompakt: ADX ve VOL görünürken daha fazla zaman dilimi için optimize edilmiştir
- Minimal: küçük ekranlar için ultra sıkı düzen
Neden yardımcı olur
- Girişlerden önce daha hızlı yukarıdan aşağıya bağlam
- Birçok grafik açmadan hızlı piyasa karşılaştırması
- Daha güçlü koşulları vurgulayarak daha temiz karar verme
Performans ve stabilite
- Daha temiz sinyaller ve daha az gürültü için kapanan mumlarda güncelleme yapacak şekilde tasarlanmıştır
- Güncelleme Kısıtlayıcısı (ms) CPU kullanımını kontrol etmek için
- Eksik semboller veya yetersiz veri için savunmacı işlem
Ana özellikler
- Çoklu sembol, çoklu zaman dilimi heatmap paneli
- Her hücre için 0–100 puan ve net yön göstergeleri
- ADX ve VOL tutarlı şekilde gösterilir
- Ayarlanabilir panel köşesi, genişlik, opaklık ve yazı tipleri
- Renk özelleştirmesi (boğa/ayı/nötr + yoğunluk aralığı)
Ana parametreler
Semboller (CSV), Zaman Dilimleri (CSV), Görüntü Yoğunluğu, Panel Genişliği/Köşe/Opaklık, VOL Göster, Yazı Tipi Boyutları, Güncelleme Kısıtlayıcısı.
Not: Bu araç piyasa bağlamı sağlar. Otomatik işlem sistemi değildir ve risk yönetiminin yerine geçmez.
Özet
The panel supports various display modes—Auto, Full, Compact, and Minimal—allowing customization for different screen sizes and detail preferences. Users can adjust panel position, width, opacity, fonts, and color schemes for bullish, bearish, and neutral conditions.
QX Heatmap Scanner updates on closed candles to reduce noise and includes an update throttle feature to manage CPU usage. It handles missing symbols or insufficient data defensively to maintain stability.
Key features include quick top-down market context, cross-market comparison without multiple charts, and highlighting of stronger trading conditions. It supports symbols such as BTCUSD, EURUSD, GBPUSD, and markets including Forex, Crypto, Stocks, Commodities, and Indices. Parameters like symbols, timeframes, display density, and update throttle are user-configurable.
This tool provides market context to assist decision-making but does not execute trades or replace risk management.
Müşteri değerlendirmeleri
5 | 33 % | |
4 | 67 % | |
3 | 0 % | |
2 | 0 % | |
1 | 0 % |


