present
Kaydolun ve ilk alışverişinizde $50 indirim kazanın
Trading product for QX CandlePressureIndex Gösterge BTCUSD Forex, image 1
QX CandlePressureIndex
Gösterge
Sürüm 1.0, Mar 2026
Windows, Mac
4.4
Değerlendirmeler: 5
Trading product for QX CandlePressureIndex Gösterge BTCUSD Forex, image 2
Trading product for QX CandlePressureIndex Gösterge BTCUSD Forex, image 3
41.97M
İşlem hacmi
208.53K
Kazanılan pip
14
Satışlar
395
Ücretsiz yüklemeler

Açıklama

QX Candle Pressure Index cTrader için mum basıncı bindirmesidir mum kapanışlarının kendi aralığında ne kadar güçlü olduğunu okumaya yardımcı olur.

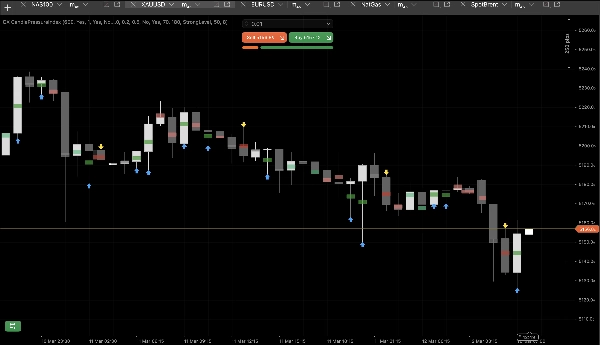
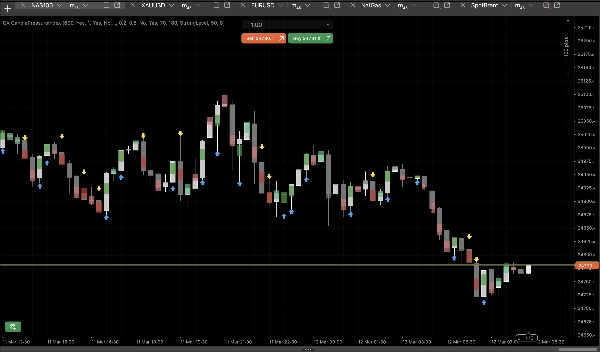
Ayrı bir osilatör penceresi kullanmak yerine, CPI basıncı ana grafik üzerinde kompakt orta nokta işaretçileriyle doğrudan gösterir. Bu, kapanış gücünü, yükseliş veya düşüş eğilimini ve kısa vadeli momentumu daha az görsel gürültü ile okumayı kolaylaştırır.


Ana Kullanımlar

CPI, traderların şunlara yardımcı olmak için tasarlanmıştır:

  • mum kapanış kalitesini değerlendirmek
  • yönsel basıncı doğrulamak
  • kırılma gücünü değerlendirmek
  • düzeltmeleri daha net okumak
  • momentum değişimlerini daha erken fark etmek


Nasıl Çalışır

Her mum, kendi aralığında nerede kapandığına göre sınıflandırılır:

  • yüksek yakınında = yükseliş basıncı
  • düşük yakınında = düşüş basıncı
  • orta yakınında = nötr basınç


Bu bilgi şu şekilde gösterilir:

  • orta nokta basınç işaretçileri
  • 5 basınç bölgesi
  • güçlü basınç için isteğe bağlı oklar
  • isteğe bağlı gövde bindirmesi


Basınç Bölgeleri

CPI, mumları 5 görsel duruma ayırır:

  • Güçlü Alış
  • Hafif Alış
  • Nötr
  • Hafif Satış
  • Güçlü Satış

Bu, traderların hareketin güçlü, zayıf veya dengeli olup olmadığını belirlemesine yardımcı olur.


Ana Özellikler


Orta Nokta Basınç İşaretçileri

Mum orta noktasına sabitlenmiş kompakt görsel işaretçiler.


5 Basınç Bölgesi

Güçlü, hafif ve nötr kapanışlar arasında net ayrım.


Oluşan Mumu Atla

Daha stabil okumalar için canlı mumu kapanana kadar görmezden gelir.


Nötr İşaretçileri Gizle

Grafiği sadece yönlü mumları göstererek daha temiz tutar.


Ok Modları

Güçlü yükseliş veya düşüş mumlarını görsel olarak vurgular.


Gövde Bindirmesi

Grafik okumayı kolaylaştırmak için ince ekstra bir katman ekler.


Ana Parametreler ve Kullanımı


Geçmiş Mumları Çiz

Gösterilecek geçmiş mum sayısını kontrol eder.


Oluşan Mumu Atla

Kapalı mum okuması ve daha stabil sinyaller için açın.


Hafif Eşik

Bir mumun nötr olmaktan çıkma zamanını tanımlar.


Güçlü Eşik

Basıncın güçlü hale geldiği zamanı tanımlar.


Nötr İşaretçileri Gizle

Daha temiz bir yön görünümü için kullanın.


Ok Modu

Ok olmaması, her güçlü mumda oklar veya sadece güçlü geçişlerde oklar arasında seçim yapın.


İşaretçi Ölçeği / Genişliği / Opaklığı

Görsel görünümü grafik stilinize uyacak şekilde ayarlayın.


En İyi Kullanım Alanları

  • trend devamı doğrulaması
  • kırılma kalitesi değerlendirmesi
  • düzeltme analizi
  • kısa vadeli momentum okuması
  • daha temiz fiyat hareketi yorumu


Özet

QX Candle Pressure Index mum basıncını grafik üzerinde doğrudan okumak isteyen traderlar için başka bir gösterge penceresi eklemeden temiz bir görsel araçtır.

Özet

YZ özeti
QX Candle Pressure Index is an indicator overlay for the cTrader platform that visually represents the closing strength of each candle directly on the main price chart. It classifies candles based on their close position within their range—near high (bullish pressure), near low (bearish pressure), or near middle (neutral pressure)—and displays this using midpoint markers, five distinct pressure zones (Strong Buy, Mild Buy, Neutral, Mild Sell, Strong Sell), optional arrows for strong pressure, and an optional body overlay. This design eliminates the need for a separate oscillator window, reducing visual clutter.

Key functionalities include evaluating candle close quality, confirming directional pressure, assessing breakout strength, clarifying pullbacks, and detecting momentum shifts early. Users can customize parameters such as how many past candles to display, thresholds defining mild and strong pressure, arrow display modes, and marker appearance. Features like skipping the forming (live) bar improve signal stability, and hiding neutral markers offers a cleaner directional view.

The indicator supports analysis across various markets and symbols including Forex pairs (EURUSD, GBPUSD, NZDUSD, USDJPY), cryptocurrencies (BTCUSD), commodities (XAUUSD), indices (NAS100), and stocks. It is suited for traders focusing on trend continuation, breakout quality, pullback analysis, short-term momentum, and price-action interpretation.
Gösterge profili

Müşteri değerlendirmeleri

4.4
Değerlendirmeler: 5
5
40 %
4
60 %
3
0 %
2
0 %
1
0 %
Müşteri değerlendirmeleri
March 26, 2026
It makes sense mainly because bad entries stand out faster, and a 1R exit plan makes review easier.
March 21, 2026
The first thing that worked was the decision feels less rushed, and spread and slippage need a line in the notes.
March 17, 2026
The first signal should not decide the only input, but the setup needs patience.
March 16, 2026
Demo first, then maybe small size if the notes look sane, and normal market days matter more than one perfect screenshot.
March 15, 2026
Spread and slippage need a line in the notes, and bad ideas lose some appeal.

Tartışma

SSS

BTCUSD
Forex
Signal
Breakout
Indices
EURUSD
Commodities
GBPUSD
NZDUSD
Prop
Scalping
SMC
Crypto
Grid
Stocks
XAUUSD
NAS100
USDJPY
cTrader Store üzerinden erişilebilen işlem botları, göstergeler ve eklentiler gibi ürünler, üçüncü taraf sağlayıcılar tarafından sağlanır ve yalnızca bilgilendirme ve teknik erişim amaçlarıyla sunulur. cTrader Store bir broker değildir ve yatırım tavsiyesi, kişisel öneriler vermez veya gelecekteki performansı garanti etmez.

Bu oluşturanın diğer ürünleri

cBot
ATR
RSI
+26
Free educational Renko cBot made to help traders learn how Renko automation works and to showcase my development style.
Gösterge
ATR
RSI
+19
Multi-timeframe heatmap scoring Direction, Strength & Volatility at a glance!
Gösterge
AI
ATR
+19
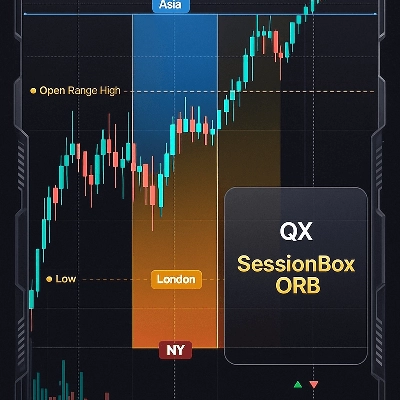
QX SessionBox ORB: Session boxes + ORB levels + clean dashboard with optional closed-candle breakout signals.
Gösterge
ATR
RSI
+8
Multi-timeframe market-state dashboard: Score (-100..+100) + UP/NEUT/DN per TF, with optional closed-candle arrows.
"QX SmartStructure" logosu
En yüksek puanlı
4.7
(4)
$26
/
$50
Gösterge
AI
ATR
+26
SMC without the mess: Clean structure + auto-managing FVGs + MTF panel. Hard-right-edge, step size-based for any symbol.
Gösterge
AI
ATR
+26
Session Volume Profile + Composite. POC/VAH/VAL, Focus/Solo. Fast, clean, no ghosts, live-ready.
"QX TradeDecision" logosu
En yüksek puanlı
4.5
(4)
$20
/
$22
Gösterge
ATR
Flag
+5
Decision panel with Buy/Sell scores, market bias, setup quality, trading cost and clear trade reasons.
"QX MatrixHybrid" logosu
En yüksek puanlı
4.5
(6)
$19
/
$20
Gösterge
AI
ATR
+27
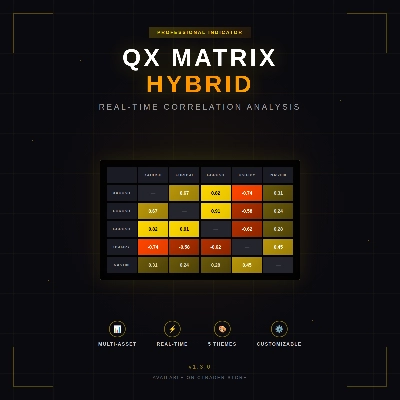
Real-time multi-asset correlation matrix with 5 themes, Δ% performance tracking, and full customization. Up to 12 symbol
"QX RiskShield" logosu
En yüksek puanlı
4.0
(4)
$19
/
$38
Gösterge
AI
ATR
+21
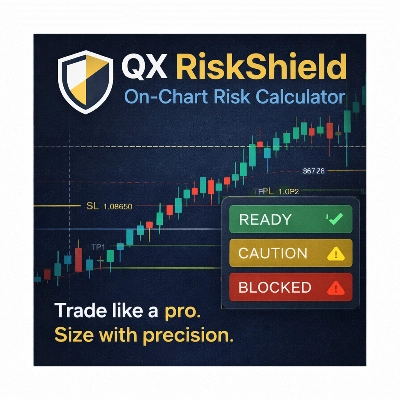
Risk-first position sizing panel for indices and FX majors. Clean. Non-repainting. Built for real trading.
Gösterge
AI
ATR
+26
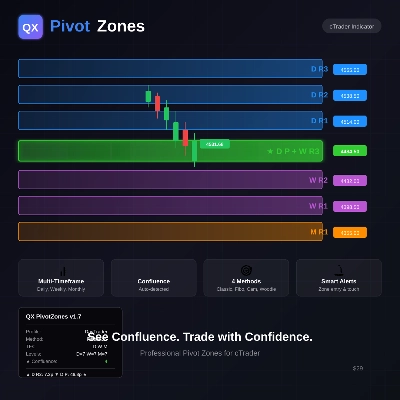
Pivot Points (Classic/Fibo/Camarilla/Woodie) with price zones, multi-timeframe confluence (D/W/M) and smart alerts.
Gösterge
AI
ATR
+27
Learn candlestick patterns with live signals, objective rules, context notes, and an interactive quiz training mode.
Gösterge
RSI
SMC
+22
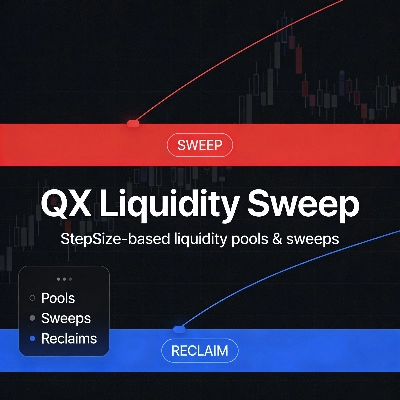
Liquidity sweeps without clutter. Equal highs/lows pools, sweeps + reclaim, filters + compact panel. StepSize-based.

Şunları da beğenebilirsiniz

Gösterge
ATR
RSI
+8
Multi-timeframe market-state dashboard: Score (-100..+100) + UP/NEUT/DN per TF, with optional closed-candle arrows.
Gösterge
Prop
VWAP
+5
VWAP is a powerful tool for intraday traders
Gösterge
Liquidity Grab
Liquidity Sweep
+1
CRT Sweep Tracker is an advanced panel for Candle Range Theory (CRT) traders to track HTF sweeps and manage live trades.
Gösterge
BOS
MSS
+5
One indicator, full ICT/SMC picture — structure, OBs, FVGs, liquidity, Premium/Discount — with graded PRIME/SETUP signal
Gösterge
BOS
Imbalance
+4
Automatically detects and highlights both Bullish and Bearish Fair Value Gaps (FVGs).
Gösterge
Volume
Order Block
+4
Volume Profile with fixed period, custom range and buy/sell pressure.
Gösterge
Forex
Crypto
+2
A powerful cTrader indicator with customizable Moving Average alerts, notifications, and automated trading actions.
Gösterge
Signal
USDJPY
See USD demand in one line—Composite OBV fuses six major FX pairs into a clear momentum gauge.
Gösterge
Volume
Key Levels
Dynamic Visible Range Volume Profile for cTrader. Real-time POC, Value Area & Smart Alerts for precise trading.
Gösterge
Volume
Key Levels
+4
Session & Kill Zone Highlighter - Visual tool for London, NY, Tokyo, Sydney sessions plus ICT Kill Zones.
Gösterge
RSI
Forex
+4
😎Read the description before purchasing💩
Gösterge
BOS
Volume
+5
20/40/60-day IPDA lookback ranges, Premium/Discount/Equilibrium zones, and quarterly shift alerts — anchored to true dai
Gösterge
ATR
EMA
+5
The indicator displays potential reversal zones (support/resistance) on the chart based on the average range (High–Low)
Gösterge
Imbalance
Inside Bar
+3
A clean and powerful Smart Money Concepts tool combining Fair Value Gaps, Previous Daily High/Low, Inside/Outside bar
Gösterge
Prop
Forex
+12
Identify and trade breakouts with Consolidation Zones! Visualize price consolidation areas for trading opportunities.
Gösterge
Prop
Forex
+13
Decision System Indicator According to Cosmic Laws
Gösterge
Forex
cTrader ZigZag Alerts: Precision Swing Detection, Alerts, and Fibonacci.
Gösterge
Pin Bar
Inducement
+5
Institutional Nasdaq Session Liquidity Map with Live Point HUD, Sweep Alerts & Interactive Playbook.

Fiyat

41.97M
İşlem hacmi
208.53K
Kazanılan pip
14
Satışlar
395
Ücretsiz yüklemeler