
Açıklama
Likidite Küme Emri (LCO) 🔍💧
1. LCO'nun gösterdikleri
Likidite Küme Emri otomatik olarak algılar ve çizer:
- Boğa likidite kümeleri (potansiyel talep / birikim bölgeleri) ✅
- Ayı likidite kümeleri (potansiyel arz / dağıtım bölgeleri) 🔻
Her küme:
- bir hacim pivot barına (hacmin yerel maksimumu) dayanır,
- son fiyat hareketine göre boğa veya ayı olarak sınıflandırılır,
- fiyat zamanda ileriye doğru uzatılır ve fiyat küme azaltana (tüketene) kadar devam eder.
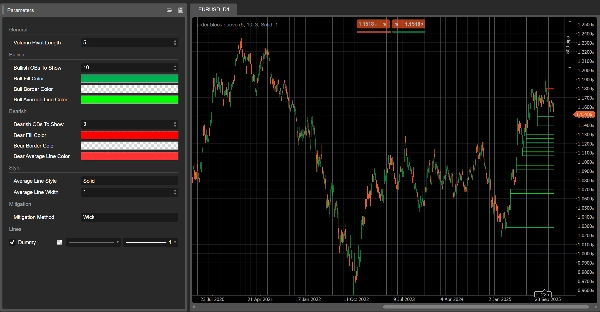
Grafikte şunları görürsünüz:
- Yeşil dikdörtgenler → boğa likidite kümeleri
- Kırmızı dikdörtgenler → ayı likidite kümeleri
- Her dikdörtgenin içinde bir gri çizgi → o kümenin ortalama fiyat seviyesi.
Bir küme azaltılmış olarak kabul edildiğinde, grafikten kaybolur ve sadece aktif kümeler kalır.
2. Algılama mantığı (basitçe)
- Hacim pivotu
-
- LCO, hacmin önceki ve sonraki
Volume Pivot Lengthbarlardan daha yüksek olduğu barları tarar. - Bu barlar hacim pivotlarıdır – likidite kümeleri için potansiyel dayanaklar.
- LCO, hacmin önceki ve sonraki
- Bağlam: boğa vs ayı
-
- Son fiyat davranışı bir bağlam belirler:
-
- Boğa bağlamı → aşağı yönlü hareket hakim olmuştur.
- Ayı bağlamı → yukarı yönlü hareket hakim olmuştur.
- Bu bağlam, sonraki hacim pivotunun boğa mı yoksa ayı mı likidite kümesi oluşturacağını belirler.
- Boğa likidite kümesi
Bir boğa bağlamında: -
- Küme altı = pivot barının düşük seviyesi
- Küme üstü = barın orta noktası (
(yüksek + düşük) / 2) - Yorum: aşağı yönlü baskının emildiği ve alıcıların agresif şekilde devreye girdiği bölge.
- Ayı likidite kümesi
Bir ayı bağlamında: -
- Küme altı = pivot barının orta noktası
- Küme üstü = pivot barının yüksek seviyesi
- Yorum: yukarı yönlü baskının emildiği ve satıcıların kontrolü ele aldığı bölge.
- Ortalama çizgi
-
- Her küme için LCO, üst ve altın ortalamasını hesaplar ve gri bir orta çizgi çizer.
- Bu, kümenin içsel denge seviyesi olarak işlev görür.
- Azaltma (küme tüketimi)
Her yeni bar üzerinde, LCO bir kümenin azaltılıp azaltılmadığını kontrol eder: -
- Boğa kümeleri için:
-
- Son
Volume Pivot Lengthbar boyunca aşağı yönlü hedef fiyatı takip eder: -
Azaltma Yöntemi = Wick→ en düşük düşük.Azaltma Yöntemi = Close→ en düşük kapanış.
- Bu hedef fiyat küme altının altına düşerse, boğa kümesi azaltılmış olarak kabul edilir ve kaldırılır.
- Son
- Ayı kümeleri için:
-
- Yukarı yönlü hedef fiyatı takip eder:
-
Wick→ en yüksek yüksek.Close→ en yüksek kapanış.
- Bu hedef fiyat küme üstünün üzerine çıkarsa, ayı kümesi azaltılmış olarak kabul edilir ve kaldırılır.
Azaltılmış = o kümedeki likiditenin tüketildiği / geçersiz kılındığı varsayılır.
3. LCO'yu grafikte nasıl okumalı
Genellikle şunları görürsünüz:
- Fiyatın altında yeşil kümeler → potansiyel talep likidite bölgeleri
- Fiyatın üstünde kırmızı kümeler → potansiyel arz likidite bölgeleri
Tipik okuma (ticaret tavsiyesi değildir):
- Yeni kümeler
-
- Yeni oluşturulan kümeler genellikle daha önemlidir:
-
- Fiyatın altındaki boğa kümesi → alıcıların son olarak satış baskısını emdiği alan.
- Fiyatın üstündeki ayı kümesi → satıcıların son olarak alım baskısını emdiği alan.
- Küme retestleri
-
- Fiyat, boğa kümesine yukarıdan geri döner:
-
- Fiyat tepki verip alt seviyeyi korursa → olası tepki / uzun pozisyon bölgesi.
- Fiyat, ayı kümesine aşağıdan geri döner:
-
- Fiyat üst seviyenin üzerine çıkamazsa → olası reddetme / kısa pozisyon bölgesi.
- Azaltılmış ve aktif kümeler
-
- Fiyat, seçilen azaltma yöntemine göre bir kümeyi sınırlarının ötesinde kestiğinde,
→ o likidite kümesi sonraki barlarda kaldırılır. - Hâlâ görünen kümeler aktif likidite bölgeleri olup henüz tamamen işlem görmemiştir.
- Fiyat, seçilen azaltma yöntemine göre bir kümeyi sınırlarının ötesinde kestiğinde,
- Orta çizginin kullanımı
-
- O gri orta çizgi şu amaçlarla kullanılabilir:
-
- küme içinde kar alma veya kısmi çıkış seviyesi,
- likidite bölgesi içinde “adil fiyat” referansı,
- fiyatın kümenin üst veya alt yarısında işlem görüp görmediğini hızlıca görmek için.
4. Parametreler (İngilizce)
Volume Pivot Length
- Hacim pivotlarını tespit etmek ve aşırılıkları ile azaltma hedefini hesaplamak için kullanılan barlar.
-
- hacim pivotlarını tespit etmek,
- aşırılıkları ve azaltma hedefini hesaplamak.
- Daha düşük değerler → daha fazla küme, daha fazla gürültü;
- Daha yüksek değerler → daha az, daha anlamlı kümeler.
Gösterilecek Boğa Likidite Kümeleri
(eski adıyla Gösterilecek Boğa OB'leri)
- Grafikte gösterilecek maksimum boğa kümeleri sayısı.
Gösterilecek Ayı Likidite Kümeleri
(eski adıyla Gösterilecek Ayı OB'leri)
- Gösterilecek maksimum ayı kümeleri sayısı.
Boğa Dolgu Rengi / Ayı Dolgu Rengi
- Boğa/ayı kümelerinin dolgu rengi.
- Alfa (opaklık) değerleri dahil edilebilir.
Boğa/Ayı Ortalama Çizgi Rengi
- Her küme için iç orta çizginin rengi.
Ortalama Çizgi Stili
- Orta çizgi için görsel stil:
"Solid","Dashed","Dotted".
Ortalama Çizgi Kalınlığı
- Orta çizginin kalınlığı.
Azaltma Yöntemi
"Wick"→ azaltma yüksek/düşük fitilleri baz alınarak yapılır (daha hassas)."Close"→ azaltma kapanış fiyatları baz alınarak yapılır (daha muhafazakar).
Özet
On the chart, bullish clusters appear as green rectangles below the price, indicating areas where buyers absorbed selling pressure. Bearish clusters are shown as red rectangles above the price, marking zones where sellers absorbed buying pressure. Each cluster includes a grey mid-line representing the average price level, serving as an internal equilibrium reference.
Clusters extend forward in time until price "mitigates" or consumes them, at which point they disappear, leaving only active liquidity zones visible. Mitigation is determined by tracking price extremes (high/low wicks or closing prices) over a configurable number of bars.
Key parameters include the volume pivot length (defining sensitivity and cluster significance), maximum clusters displayed, cluster colors, mid-line style, and mitigation method. LCO supports various markets including forex, indices, commodities, stocks, and cryptocurrencies, and integrates with multiple trading strategies and indicators such as RSI, MACD, Bollinger Bands, and Fibonacci levels.
Müşteri değerlendirmeleri
5 | 100 % | |
4 | 0 % | |
3 | 0 % | |
2 | 0 % | |
1 | 0 % |


!["[Hamster-Coder] Pivot Points MTF" logosu](https://cdn.ctrader.com/image/webp/4c143e5a-309c-40e3-a578-f04d1e133ffa_31159)


