
Penerangan
🚀 Sistem Pecahan Saluran
Algoritma khusus ini direka untuk mengesahkan titik masuk dan keluar dengan tepat 🎯 dengan menggabungkan pelbagai elemen analisis teknikal untuk memberikan isyarat yang boleh dipercayai.
🔍 Bagaimana Ia Berfungsi?
📊 Saluran Berasaskan Volatiliti (ATR)
✅ Volatiliti pasaran dikira menggunakan ATR (Julat Benar Purata) 📉.
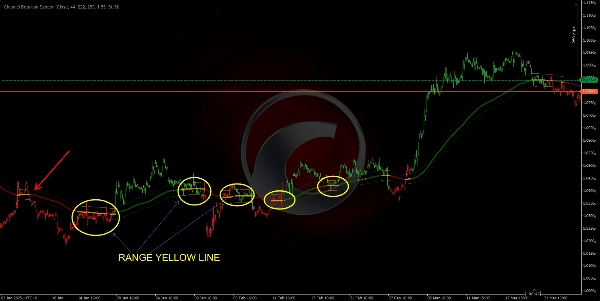
✅ "Trend MA" disesuaikan dengan menambah dan menolak nilai yang berkadar dengan volatiliti ini, membentuk dua garis bertitik yang bertindak sebagai "siling" dan "lantai" pasaran.
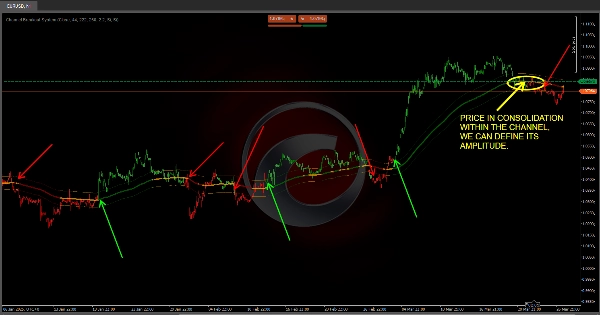
✅ Apa maksud ini untuk anda? Jika harga kekal dalam saluran, pasaran mungkin berada dalam fasa julat atau pengukuhan; jika ia jelas melepasi, ia adalah isyarat pergerakan tren yang kuat 📈📉.
✅ Boleh disesuaikan sepenuhnya! Laraskan tetapan saluran mengikut strategi anda 📌.
🟢 Pengesanan Tren dengan Warna Pintar
🔹 Penunjuk membandingkan kedudukan MA pantas dengan MA sederhana, dan kedua-duanya berhubung kait dengan Trend MA.
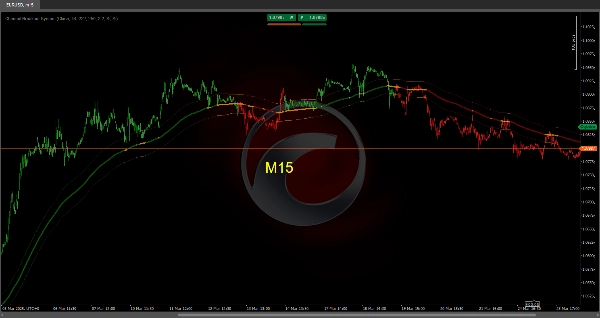
🔹 Berdasarkan fasa pasaran, lilin berubah warna:
- 🟢 Hijau → Fasa pasaran menaik.
- 🔴 Merah → Fasa pasaran menurun.
- 🟠 Jingga atau neutral → Mungkin pengukuhan atau ketidakpastian.
🔹 Jika harga dan purata bergerak "terperangkap" dalam saluran, ia menandakan fasa pengukuhan, membantu anda mengelakkan perdagangan dalam zon yang tidak pasti.
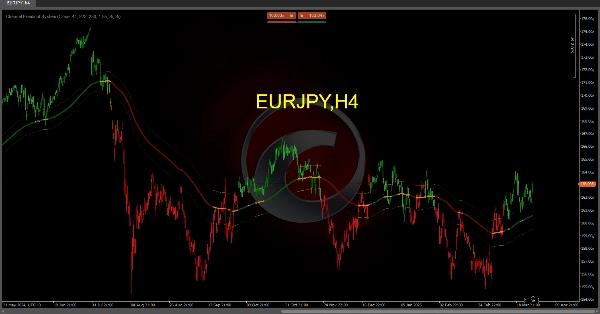
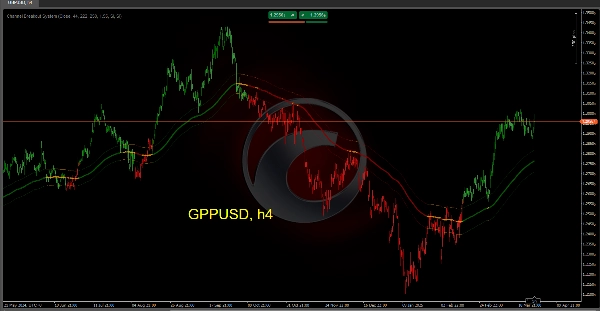
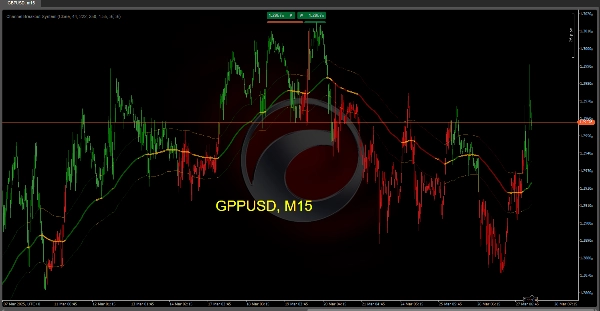
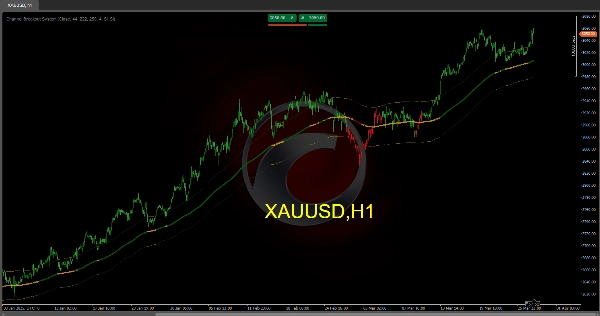
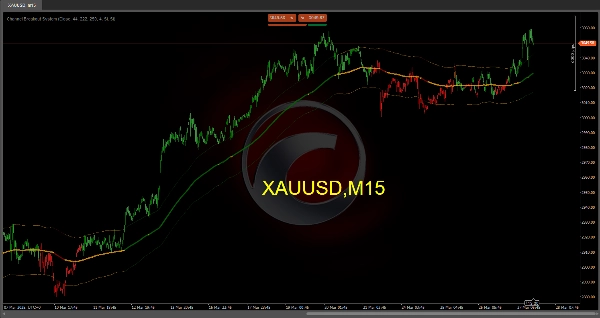
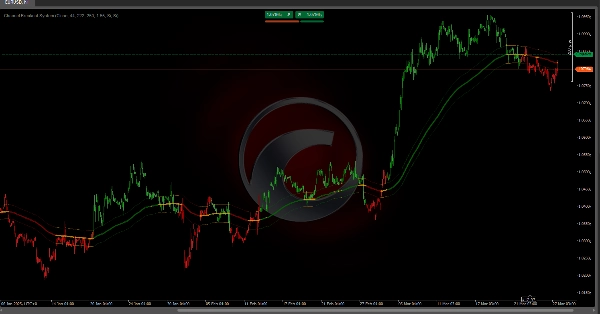
🎯 Bagaimana Ia Kelihatan pada Carta
🔵 Garis tren utama: Berubah warna mengikut arah pasaran (hijau, merah, atau jingga).
📏 Saluran bertitik: Mencerminkan julat pasaran berdasarkan volatiliti.
📊 Bar berwarna: Memberikan representasi visual mudah bagi fasa pasaran semasa.
🚀 Mengapa Menggunakan Sistem Ini?
✔ Cepat mengenal pasti sama ada pasaran sedang tren atau julat.
✔ Menonjolkan secara visual kekuatan dan arah tren.
✔ Meramalkan kemungkinan pembalikan dengan isyarat pecahan dan persilangan yang jelas.
✔ Mengesahkan titik masuk dan keluar, mengurangkan isyarat palsu dan meningkatkan ketepatan perdagangan.
🔹 Optimumkan perdagangan anda dan beroperasi dengan keyakinan lebih tinggi menggunakan Sistem Pecahan Saluran 🏆. Bersedia untuk mengenal pasti peluang pasaran terbaik! 📈🔥
Penunjuk Kedai Ctrader:
Struktur Pasaran Dinamik
Analisis Titik Pusing
Fibonacci Linear
Regresi Multi-masa
Bias Lilin Berbilang Tahap
Penjejak
Garis Tren Sokongan dan
Rintangan Auto
Semua Tahap Sokongan dan
Rintangan
Ringkasan
Ulasan pelanggan
5 | 33 % | |
4 | 67 % | |
3 | 0 % | |
2 | 0 % | |
1 | 0 % |


