
IM_AngleIndicator
지표
1 구매
버전 2.0, Jul 2026
Windows, Mac
4.5
리뷰: 2
설명
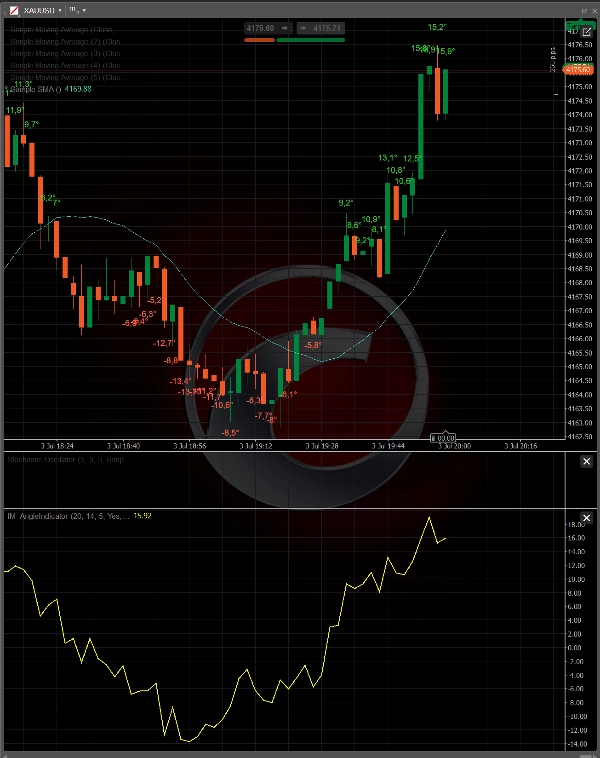
IM_AngleIndicator는 단순 이동 평균의 기울기를 객관적이고 비교 가능한 각도 측정값으로 변환합니다.
대부분의 "각도" 지표는 원시 가격 변동에서 기울기를 계산하지만, 결과는 도구의 절대 규모와 시간 프레임에 따라 달라집니다 — 따라서 동일한 각도 값이 통화 교차, 지수 또는 암호화폐에서 완전히 다른 의미를 가집니다. IM_AngleIndicator는 ATR로 SMA 변화를 정규화하여 이를 해결합니다: 기울기는 "바당 ATR"로 표현된 후 각도로 변환됩니다. 이렇게 하면 45°의 기울기는 분석 중인 도구나 시간 프레임에 관계없이 항상 바당 1 ATR의 움직임을 나타냅니다. 결과는 일관된 판독값과 전체 포트폴리오에서 재사용할 수 있는 임계값입니다.
작동 원리
- 선택한 기간에 따라 종가에서 SMA를 계산합니다.
- 연속된 두 바 사이의 변화를 측정하고 ATR로 나누어 정규화합니다.
- 결과 비율을 아크탄젠트를 통해 각도로 변환하여 대략 −90°에서 +90° 사이의 값을 반환합니다.
- 값을 전용 패널의 오실레이터로 표시하고, 기울기가 설정된 임계값을 초과하면 가격 차트에 라벨을 추가하며, 강세 추세일 때는 고점 위에, 약세 추세일 때는 저점 아래에 위치시킵니다.
주요 특징
- ATR 정규화를 통해 도구 및 시간 프레임에 독립적인 기울기 측정.
- 중요한 움직임을 필터링하고 노이즈를 제외하기 위한 각도 단위의 구성 가능한 임계값.
- 방향성 색상 코드 라벨(상승 시 녹색, 하락 시 빨간색)과 캔들에 대해 깔끔한 배치를 위한 ATR 기반 수직 오프셋.
- 최적화된 차트 객체 처리: 라벨은 최신 바에만 제한되어 긴 기록의 차트에서도 성능을 유지합니다.
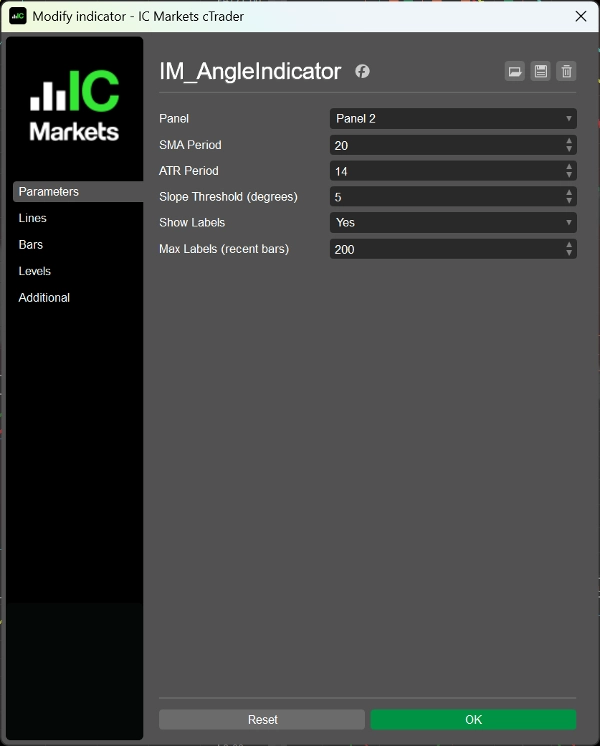
- 완전한 사용자 정의 가능한 매개변수: SMA 기간, ATR 기간, 기울기 임계값, 라벨 가시성, 최대 라벨 수.
사용 사례
- 강한 추세 구간과 횡보 구간 식별.
- 진입 및 청산 전략을 지원하는 방향성 확인.
- 동일한 임계값을 사용하여 여러 도구 간 추세 강도 비교.
- 정규화된 기울기를 거래 신호로 사용하는 cBot 개발의 기초.
요약
지표 프로필
지표 카테고리
추세
출력 유형
시각화
데이터 요구 사항
막대만
지원되는 신호
추세 강도
고객 리뷰
4.5
리뷰: 2
5 | 50 % | |
4 | 50 % | |
3 | 0 % | |
2 | 0 % | |
1 | 0 % |
고객 리뷰
November 19, 2024
The setup needs a cleaner reason to exist, but sideways markets can fake the filter.
November 13, 2024
kinda useful when the chart is messy. It can look better than it is during a lucky run.
상담
자주 묻는 질문(FAQ)
Forex
Signal
EURUSD
Commodities
XAUUSD
트레이딩 봇, 지표, 플러그인 등 cTrader Store에서 제공되는 상품은 제3자 개발자에 의해 제공되며, 이는 단순히 정보 및 기술적 접근을 목적으로 제공된 것입니다. cTrader Store는 중개인이 아니며, 투자 조언, 개인별 추천 또는 향후 성과에 대한 어떠한 보장도 제공하지 않습니다.


!["[Stellar Strategies] MARSI Signal Plotter" 로고](https://cdn.ctrader.com/image/webp/7b2b8da6-8f8e-4646-8d4a-4710c516c01e_25567)


가격
가입일 11/11/2024
33.44M
거래량
72.4K
핍 수익
1
판매