
Description
ZIGXRAY — VOYEZ LES OS DU MARCHÉ (VERSION 🇧🇷 CI-DESSOUS)
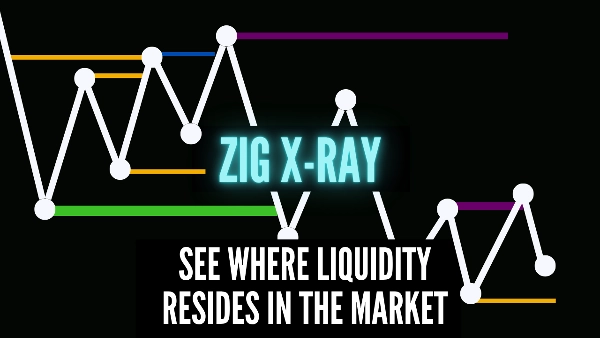
Arrêtez de deviner où la structure s'aligne. ZigXRay agit comme un scanner structurel, superposant jusqu'à 4 couches ZigZag indépendantes de différents timeframes sur un seul graphique. Son moteur avancé identifie les "Pivots Convergents" - des points où plusieurs timeframes s'accordent sur un sommet ou un creux - signalant des zones de retournement à haute probabilité.
COMMENT CADRER UN TRADE AVEC L'AIDE DE L'INDICATEUR ?
Les autres indicateurs utilisés dans la vidéo sont également disponibles dans la cTrader Store.
✅ POURQUOI ZIGXRAY EST RÉVOLUTIONNAIRE :
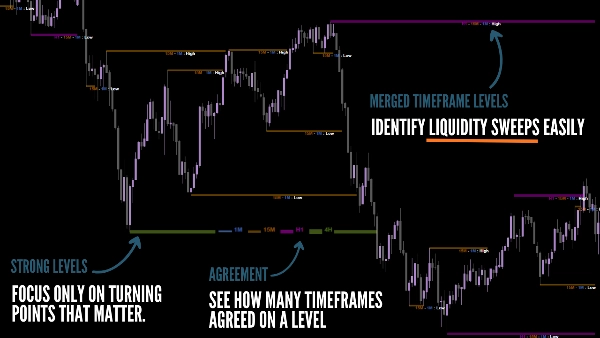
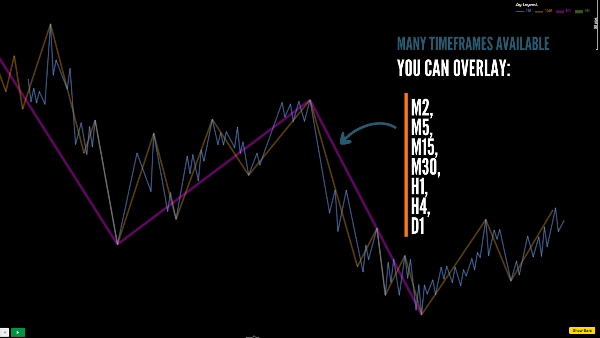
- Détection Automatique de Convergence : Met instantanément en évidence les niveaux où 2, 3 ou 4 timeframes (ex : M5, M15, H1) forment un pivot simultanément.
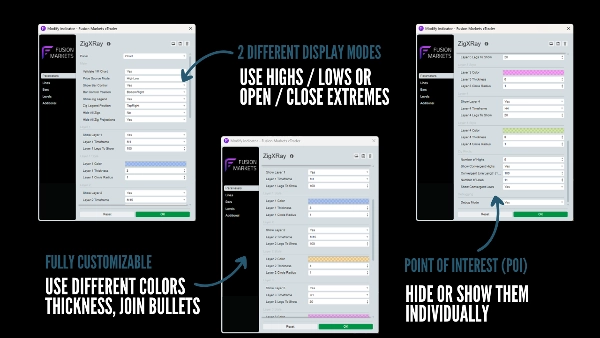
- Basé sur le Corps ou la Mèche : Alternez entre le mappage traditionnel haut/bas ou les "Extrêmes Ouverture/Fermeture" pour filtrer le bruit du marché et vous concentrer sur la structure du corps des chandeliers.
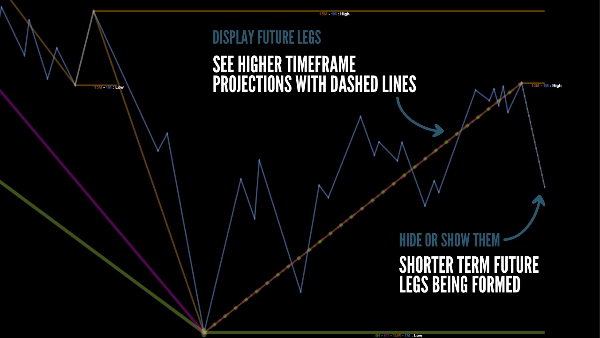
- Projections Prédictives : Contrairement aux indicateurs standards, ZigXRay trace des "Projections en Pointillés" pour la jambe actuelle, se mettant à jour en temps réel à mesure que le prix évolue.
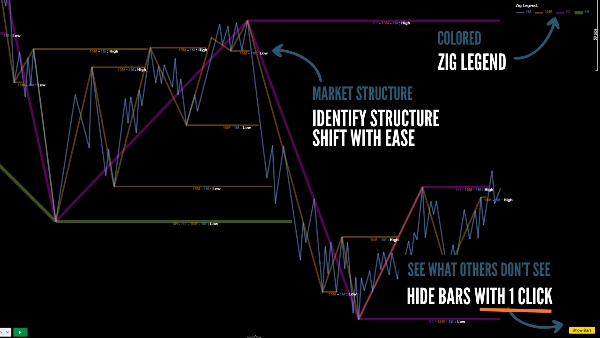
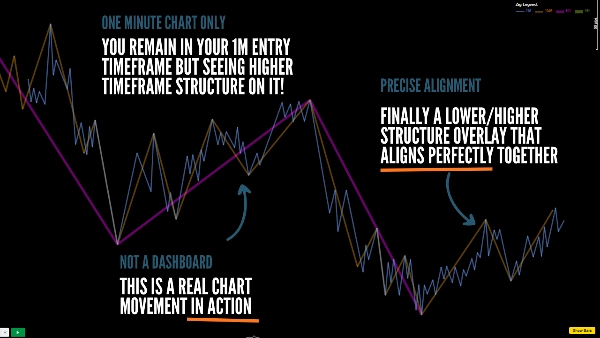
- Mode Graphique Nu : Nettoyez instantanément votre espace de travail. Cachez toutes les chandelles et ne laissez visible que la structure squelettique de ZigXRay pour une analyse pure de l'action des prix.
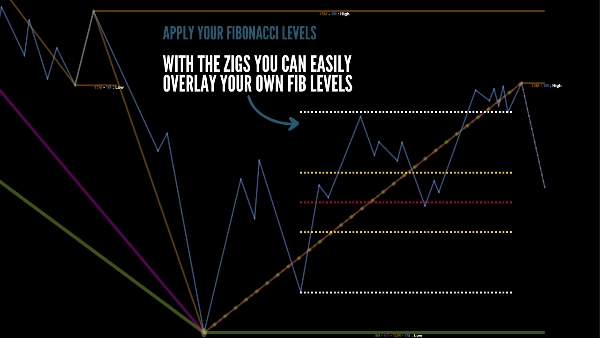
- Niveaux Élagués Intelligents : Les lignes convergentes sont automatiquement "élaguées" lorsque le prix les traverse, vous montrant exactement quels niveaux sont encore valides (non atténués).
🛠️ POINTS TECHNIQUES :
- 4 Runtimes Indépendants : Chaque couche possède son propre timeframe, épaisseur et paramètres de couleur.
- Légende Dynamique : Un panneau intelligent identifie quelle couleur appartient à quel timeframe, s'adaptant à la position de votre graphique.
- Précision M1 : Utilise un flux de données d'une minute pour une précision maximale dans la détection des pivots, quel que soit le timeframe principal de votre graphique.
- UX Adaptative : Les contrôles des boutons et les légendes inversent automatiquement le contraste entre les thèmes clair et sombre.
⚠️ NOTE D'UTILISATION IMPORTANTE : Pour garantir une précision à 100 % dans la convergence des pivots et la synchronisation des données M1, ZigXRay est optimisé pour le graphique 1 Minute (M1). Bien qu'il puisse superposer des timeframes supérieurs, le graphique actif doit être en M1 pour la meilleure expérience et pour que les zigzags et niveaux s'affichent.
🇧🇷 ZIGXRAY — VOYEZ LE SQUELETTE DU MARCHÉ
Arrêtez de deviner où la structure s'aligne. Le ZigXRay fonctionne comme un scanner structurel, superposant jusqu'à 4 couches indépendantes de ZigZag de différents timeframes sur un seul graphique. Son moteur avancé identifie les "Pivots Convergents" - des points où plusieurs timeframes s'accordent sur un sommet ou un creux - signalant des zones de retournement à haute probabilité.
COMMENT POSITIONNER UN TRADE AVEC L'AIDE DE L'INDICATEUR ?
Les autres indicateurs utilisés dans le clip vidéo sont également disponibles dans la cTrader Store.
✅ POURQUOI LE ZIGXRAY EST RÉVOLUTIONNAIRE :
- Détection Automatique de Convergence : Met instantanément en évidence les niveaux où 2, 3 ou 4 timeframes (ex : M5, M15, H1) forment un pivot simultanément.
- Basé sur le Corps ou la Mèche : Alternez entre le mappage traditionnel haut/bas ou les "Extrêmes Ouverture/Fermeture" pour filtrer le bruit et vous concentrer sur la structure réelle du corps de la bougie.
- Projections Prédictives : Contrairement aux indicateurs standards, ZigXRay dessine des "Projections en Pointillés" pour la jambe actuelle, se mettant à jour en temps réel à mesure que le prix évolue.
- Mode Graphique Nu (Naked) : Nettoyez instantanément votre configuration. Cachez toutes les bougies et ne laissez visible que la structure squelettique de ZigXRay.
- Niveaux avec Coupe Intelligente : Les lignes de convergence sont automatiquement "coupées" lorsque le prix les traverse, montrant exactement quels niveaux sont encore valides.
🛠️ POINTS TECHNIQUES :
- 4 Runtimes Indépendants : chaque couche possède ses propres réglages de timeframe, épaisseur et couleur, fonctionnant de manière isolée et simultanée.
- Légende Dynamique : un panneau intelligent identifie quelle couleur appartient à quel timeframe, s'adaptant automatiquement à la position de votre graphique pour ne pas obstruer la vue.
- Précision M1 : utilise un flux de données d'une minute pour une précision maximale dans la détection des pivots, quel que soit le timeframe principal que vous utilisez sur le graphique.
- UX Adaptative : les boutons de contrôle et les légendes alternent automatiquement le contraste entre thèmes clairs et sombres, garantissant une lisibilité totale dans n'importe quelle configuration.
- Mémoire de Performance : l'indicateur gère efficacement l'historique des jambes (Legs to Show), garantissant que votre cTrader reste rapide même avec 4 couches actives.
⚠️ NOTE D'UTILISATION IMPORTANTE : Pour garantir une précision à 100 % dans la convergence des pivots et la synchronisation des données, le ZigXRay est optimisé pour le graphique 1 Minute (M1). Bien qu'il projette des timeframes supérieurs, le graphique actif doit être en M1 pour la meilleure performance et pour que les zigzags et niveaux soient affichés.
Résumé
Avis clients
5 | 33 % | |
4 | 67 % | |
3 | 0 % | |
2 | 0 % | |
1 | 0 % |


![Logo de "[Stellar Strategies] Inside Bar with Signals"](https://cdn.ctrader.com/image/webp/1d9e8bfa-3b2c-4440-bb37-5856902008a7_30683)


