BubbleXRay
อินดิเคเตอร์
11 การซื้อ
เวอร์ชัน 1.1, Apr 2026
Windows, Mac
4.0
รีวิว: 2
Trading product for BubbleXRay อินดิเคเตอร์ Key Levels Liquidity Sweep, image 2
Trading product for BubbleXRay อินดิเคเตอร์ Key Levels Liquidity Sweep, image 3
Trading product for BubbleXRay อินดิเคเตอร์ Key Levels Liquidity Sweep, image 4
Trading product for BubbleXRay อินดิเคเตอร์ Key Levels Liquidity Sweep, image 5
Trading product for BubbleXRay อินดิเคเตอร์ Key Levels Liquidity Sweep, image 6
Trading product for BubbleXRay อินดิเคเตอร์ Key Levels Liquidity Sweep, image 7
Trading product for BubbleXRay อินดิเคเตอร์ Key Levels Liquidity Sweep, image 8
Trading product for BubbleXRay อินดิเคเตอร์ Key Levels Liquidity Sweep, image 9
ตั้งแต่ 09/02/2026
15
การขาย
119
ติดตั้งฟรี

คำอธิบาย

BUBBLEXRAY — เครื่องมือ X-RAY ปริมาณฟองสบู่ขั้นสูงสุดสำหรับ CTRADER ( เวอร์ชัน 🇧🇷 ด้านล่าง)

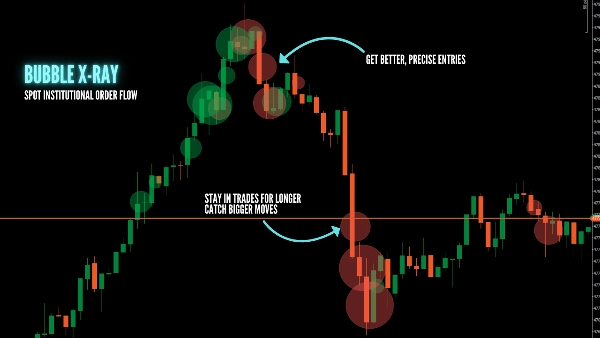
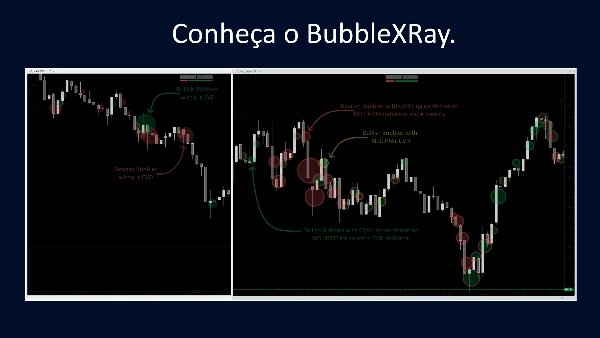
ระบุจุดที่เงินจริงเคลื่อนไหว. BubbleXRay ระบุจุดสูงสุดของปริมาณสูงและแสดงเป็นฟองสบู่ที่มีสัดส่วนโดยตรงบนราคาของคุณ แสดงการเปลี่ยนแปลงปริมาณสะสมเดลต้า (CVD) ที่รวมอยู่ในตัวบ่งชี้เดียวโดยไม่ทำให้กราฟของคุณรกหรือสกปรก ไม่ต้องเดาอีกต่อไป—เห็นรอยเท้าของสถาบันทันทีที่เกิดขึ้น

✅ ทำไมต้องใช้ BUBBLEXRAY?

  • จุดสูงสุดกิจกรรมทันที: ฟองสบู่จะปรากฏขึ้นทันทีที่แท่งปริมาณสูงปิดลง
  • รอยเท้าสถาบัน: ฟองสบู่ขนาดใหญ่ที่ระดับสำคัญเผยให้เห็นว่าผู้เล่นรายใหญ่กำลังทำกิจกรรมที่ไหน
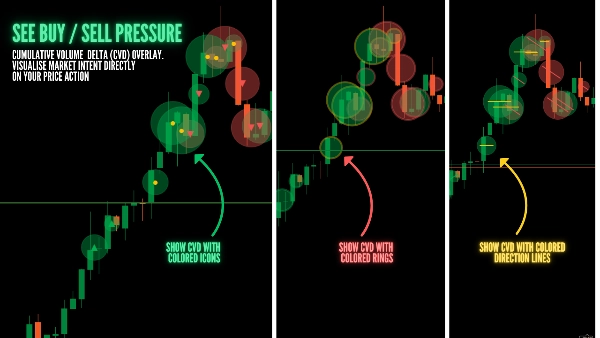
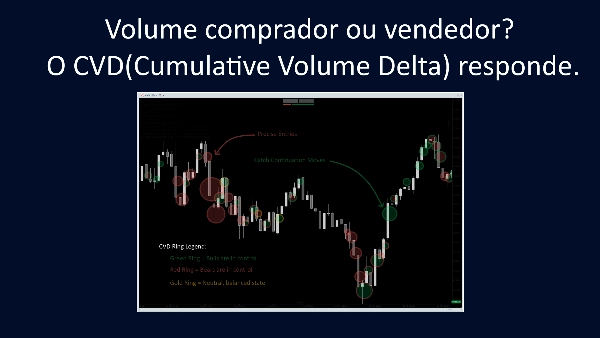
  • ข้อมูล CVD: ปริมาณสะสมเดลต้าแบบบูรณาการแสดงว่าการเพิ่มขึ้นนั้นเป็นแรงกดดันจากการซื้อหรือการขาย
  • ปรับขนาดอัตโนมัติ: หน้าต่างเปอร์เซ็นไทล์แบบเลื่อนปรับให้เข้ากับสภาพตลาดใด ๆ (แนวโน้มหรือช่วง)
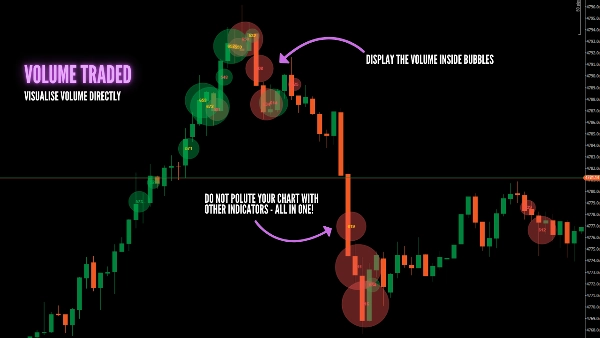
  • ยึดกับราคา: ปริมาณจะแสดงที่ระดับราคาที่แน่นอน ไม่ซ่อนอยู่ในฮิสโตแกรมย่อย

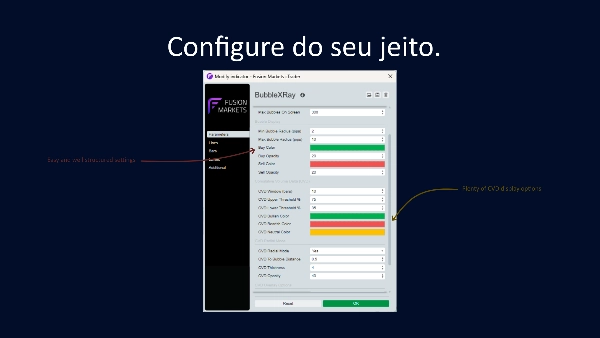
ตัวอย่างตั้งค่าล่วงหน้า: ทองคำ (XAUUSD) - กราฟ 1 นาที

  • เกณฑ์เปอร์เซ็นไทล์ปริมาณ: 80
  • หน้าต่างเปอร์เซ็นไทล์ (แท่ง): 250
  • จำนวนฟองสบู่สูงสุดบนหน้าจอ: 20
  • รัศมีฟองสบู่ขั้นต่ำ (พิป): 5
  • รัศมีฟองสบู่สูงสุด (พิป): 20
  • ระยะเวลาการเลื่อน CVD (แท่ง): 10
  • การมองย้อนหลังความชัน CVD (แท่ง): 7
  • ตัวคูณ CVD แบน: 1.8
  • โหมดรัศมี CVD: ไม่
  • ระยะห่างจาก CVD ถึงฟองสบู่: 0.5
  • ความหนา CVD: 4
  • ความทึบ CVD: 40
  • ตัวเลือกการซ้อนทับ CVD: ไม่
  • โหมดดีบัก: ไม่

📺 ดูวิดีโอสอนและเข้าร่วมชุมชน:


(โปรดโพสต์คำถาม/คำขอสนับสนุนของคุณในความคิดเห็นของวิดีโอเพื่อช่วยให้ชุมชนของเราเติบโต!)

🛠️ คุณสมบัติหลัก:

  • ขนาดตามสัดส่วน: ขนาดฟองสบู่ปรับตามขนาดของปริมาณอย่างเส้นตรง
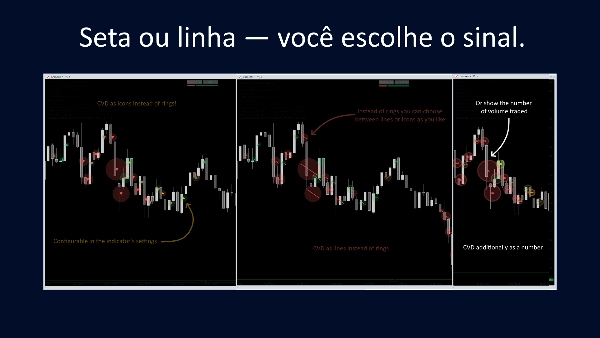
  • การยืนยันคู่: รวมวงแหวนรัศมีและลูกศรซ้อนเพื่อบริบท CVD ที่ลึกขึ้น
  • ไม่มีการตั้งค่า: เลือกช่วงเวลาข้อมูลที่ดีที่สุดสำหรับกราฟของคุณโดยอัตโนมัติ
  • อินเทอร์เฟซสะอาด: ปรับความทึบและขีดจำกัดการแสดงผลเพื่อให้กราฟของคุณดูเป็นมืออาชีพ

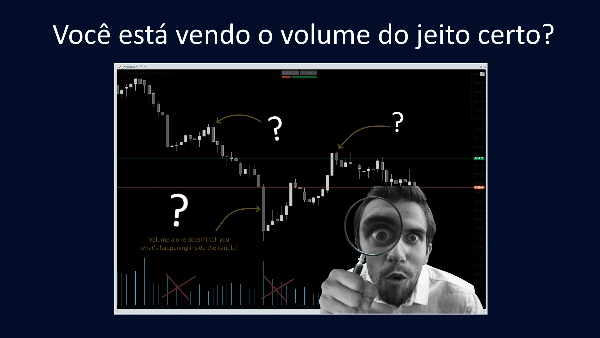
🇧🇷 BUBBLEXRAY — O RAIO-X DE VOLUME DEFINITIVO PARA CTRADER

Identifique onde o "Smart Money" está atuando. O BubbleXRay marca picos de alto volume com bolhas proporcionais diretamente no preço. Exiba a variação acumulada do volume (CVD) integrada em um único indicador, sem sobrecarregar ou poluir seu gráfico.Chega de dúvidas: veja o rastro institucional no momento em que ele ocorre.

✅ POR QUE USAR O BUBBLEXRAY?

  • Picos de Atividade Instantâneos: As bolhas surgem assim que uma barra de alto volume fecha.
  • Rastros Institucionais: Bolhas grandes em níveis-chave revelam a atuação de grandes players.
  • Inteligência CVD: O Delta de Volume Acumulado integrado mostra se a pressão foi de Compra ou Venda.
  • Auto-Ajustável: O sistema de percentil se adapta a qualquer mercado (Tendência ou Lateralização).
  • Ancorado ao Preço: O volume é exibido no nível exato da ação, não escondido em histogramas inferiores.

📺 ASSISTA AO TUTORIAL E TIRE SUAS DÚVIDAS:


(Por favor, poste suas dúvidas e pedidos de suporte nos comentários do vídeo acima, assim ajudamos ao máximo de pessoas!)

🛠️ DESTAQUES TÉCNICOS:

  • Tamanho Proporcional: O raio da bolha escala conforme a magnitude do volume.
  • Confirmação Dupla: Use o Anel Radial e a Seta Interna para um contexto profundo de CVD.
  • Configuração Zero: Seleciona automaticamente o melhor timeframe de dados para seu gráfico.
  • Interface Limpa: Opacidade e limites de exibição configuráveis para manter seu setup profissional.


สรุป

สรุปโดย AI
BubbleXRay is a volume-based trading indicator designed for the cTrader platform that visualizes institutional order flow through proportional volume bubbles directly on price charts. It highlights high-volume spikes as bubbles sized according to volume magnitude, enabling traders to identify where significant market participants are active. The indicator integrates Cumulative Volume Delta (CVD) data to distinguish buying versus selling pressure, providing deeper insight into volume dynamics without cluttering the chart. Key features include instant detection of volume spikes upon bar close, auto-scaling via a rolling percentile window adaptable to trending or ranging markets, and price-anchored volume display rather than separate histograms. Additional functionalities include dual confirmation using radial rings and overlay arrows for enhanced CVD context, zero-configuration automatic timeframe selection, and customizable opacity and display limits for a clean user interface. The indicator supports analysis of key market structure concepts such as key levels, liquidity sweeps, imbalances, supply and demand zones, and support/resistance. A preset example configuration is provided for Gold (XAUUSD) on a 1-minute chart. A tutorial video is available to assist users in setup and application. BubbleXRay requires volume and tick data and outputs visual signals directly on price charts.
โปรไฟล์อินดิเคเตอร์
หมวดหมู่อินดิเคเตอร์
ปริมาณ
ประเภทเอาต์พุต
การแสดงเป็นภาพ
ข้อกำหนดด้านข้อมูล
ปริมาณ
ข้อมูล Tick
แท่งเท่านั้น

รีวิวจากลูกค้า

4.0
รีวิว: 2
5
0 %
4
100 %
3
0 %
2
0 %
1
0 %
รีวิวจากลูกค้า
April 20, 2026
It becomes more useful when it makes overtrading easier to notice. Size control still matters.
April 16, 2026
The first 10 trades should stay boring. Bad setups become easier to pass on, and the chart still needs a final look.

การสนทนา

คำถามที่พบบ่อย

Key Levels
Liquidity Sweep
Imbalance
Volume
Supply & Demand
Liquidity Grab
Support & Resistance
ผลิตภัณฑ์ที่มีให้บริการผ่าน cTrader Store รวมถึงบอทการเทรด อินดิเคเตอร์ และปลั๊กอิน มีให้บริการโดยนักพัฒนาบุคคลที่สามและมีไว้เพื่อวัตถุประสงค์ในการเข้าถึงข้อมูลและทางเทคนิคเท่านั้น cTrader Store ไม่ใช่โบรกเกอร์และไม่ได้ให้คำแนะนำการลงทุน คำแนะนำส่วนบุคคล หรือการรับประกันผลการดำเนินงานในอนาคต

เพิ่มเติมจากผู้เขียนคนนี้

อินดิเคเตอร์
BOS
CHOCH
+5
Spot market structure shift with ease, overlay timeframes, avoid false breakouts with open close pivots, hide chart bars
อินดิเคเตอร์
Forex
EURUSD
+5
Fimathe Indicator - Fimathe PCM - Automated Trend Channels & Levels — Ideal for live trading and backteting
อินดิเคเตอร์
CHOCH
Key Levels
+5
ZigZag Market Structure Identifier - Multi-Layer Scanner: Convergent Pivot Detection, 4-TF Overlay & Naked Chart Mode.
cBot
Fixed Lot
TP Manager
+5
Hotkeys Trading Assistant - Professional Shortcut Assitant with Risk Manager, Hotkeys & Lot Sizing.
อินดิเคเตอร์
Key Levels
Break & Retest
+5
Premium Discount Levels - Professional Dealing Range Zones with Draggable Lines, Alerts, Wartermark & Backtest Mode.
อินดิเคเตอร์
Key Levels
Order Block
+5
FVG Levels — Auto-Detection of Multi-Timeframe Fair Value Gaps & GAPs, Smart Filters and Liquidity Zone Monitoring

นอกจากนี้คุณยังอาจชอบ

อินดิเคเตอร์
Drawdown Monitor
Proprietary trading desk risk monitoring dashboard!
อินดิเคเตอร์
[Hamster-Coder] Pivot Points (Multi Time Frame)
อินดิเคเตอร์
AI
SMC
+17
Smart Support/Resistance lines auto calculated from D1/H4/H1/M15. Highly customizable visuals + built in Backtest Mode.
อินดิเคเตอร์
AI
SMC
+5
Coloring trendline/ Colored Trendline / Color Trendline
อินดิเคเตอร์
Prop
Forex
+4
A precision-crafted indicator that compares current volume to its historical average for the same time of day.
อินดิเคเตอร์
SMC
Forex
+4
Identifies institutional zones with Volume Delta (K) across any asset or chart for high-precision entry detection.
"LT Flexible Volume Profile" โลโก้
ยอดนิยม
5.0
(3)
$19
อินดิเคเตอร์
Forex
Flexible Volume Profile, designed with performance in mind.
อินดิเคเตอร์
MSS
Key Levels
+2
Maps equal highs, equal lows and active liquidity pools directly on your cTrader chart.
"Parabolic RSI Alert  V1" โลโก้
ยอดนิยม
4.5
(2)
$19
อินดิเคเตอร์
Master RSI reversals with Parabolic SAR precision! Get real-time alerts for high-probability trend changes.
"SmartFibonacci" โลโก้
ยอดนิยม
5.0
(2)
$19
/
$30
อินดิเคเตอร์
SmartFibonacci — automatic Fibonacci retracements & extensions with swing detection, alerts and clean labels for cTrader
"VegaXLR - ZigZag Alerts" โลโก้
ยอดนิยม
4.3
(3)
$20
อินดิเคเตอร์
Forex
cTrader ZigZag Alerts: Precision Swing Detection, Alerts, and Fibonacci.
อินดิเคเตอร์
EMA
SMA
+3
Pro MA Close Alert. Powerful indicator that instantly notifies you when price closes above or below your selected MA.
อินดิเคเตอร์
Prop
Forex
+12
A clean, real-time risk HUD designed to prevent prop firm account failure and protect your challenge account.
อินดิเคเตอร์
MACD
Key Levels
+2
Trend indicator with multi-timeframe filters, generating signals only on fully completed bricks & candles. No Repaint.
อินดิเคเตอร์
RSI
Breakout
+1
Dynamically adjusts regression channels based on ZigZag extremes, resetting when price breaks bands to track real trends
"Supertrend" โลโก้
ยอดนิยม
4.3
(3)
$19
อินดิเคเตอร์
ATR
RSI
+6
💹 Define a price channel 📈 and determine trend direction (bullish 🟢 or bearish 🔴).
อินดิเคเตอร์
VWAP
Forex
+13
Custom VWAP Indicator for cTrader
อินดิเคเตอร์
BOS
MSS
+3
Orderblocks with Multi-Timeframe.

ราคา

ตั้งแต่ 09/02/2026
15
การขาย
119
ติดตั้งฟรี