present
ลงทะเบียนและรับส่วนลด $50 สำหรับการซื้อครั้งแรกของคุณ
Trading product for TradeLens อินดิเคเตอร์ Chart UI Tools Key Levels, image 1
TradeLens
อินดิเคเตอร์
เวอร์ชัน 1.3, Sep 2026
Windows, Mac
4.5
รีวิว: 4
Trading product for TradeLens อินดิเคเตอร์ Chart UI Tools Key Levels, image 2
Trading product for TradeLens อินดิเคเตอร์ Chart UI Tools Key Levels, image 3
Trading product for TradeLens อินดิเคเตอร์ Chart UI Tools Key Levels, image 4
Trading product for TradeLens อินดิเคเตอร์ Chart UI Tools Key Levels, image 5
Trading product for TradeLens อินดิเคเตอร์ Chart UI Tools Key Levels, image 6
Trading product for TradeLens อินดิเคเตอร์ Chart UI Tools Key Levels, image 7
Trading product for TradeLens อินดิเคเตอร์ Chart UI Tools Key Levels, image 8
Trading product for TradeLens อินดิเคเตอร์ Chart UI Tools Key Levels, image 9
Trading product for TradeLens อินดิเคเตอร์ Chart UI Tools Key Levels, image 10
Trading product for TradeLens อินดิเคเตอร์ Chart UI Tools Key Levels, image 11
ตั้งแต่ 09/02/2026
29
การขาย
179
ติดตั้งฟรี

คำอธิบาย

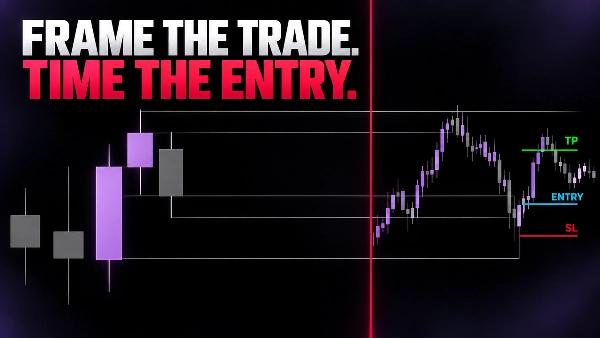
TRADELENS - รักษาบริบท ดูรายละเอียด

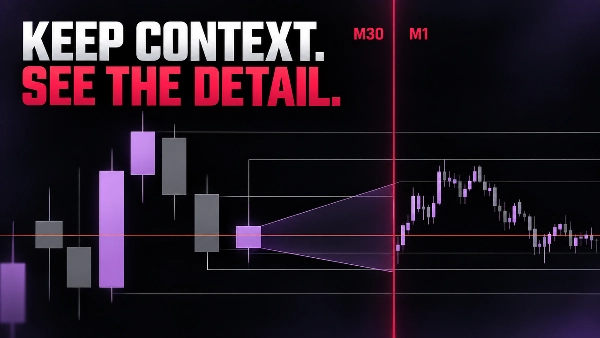
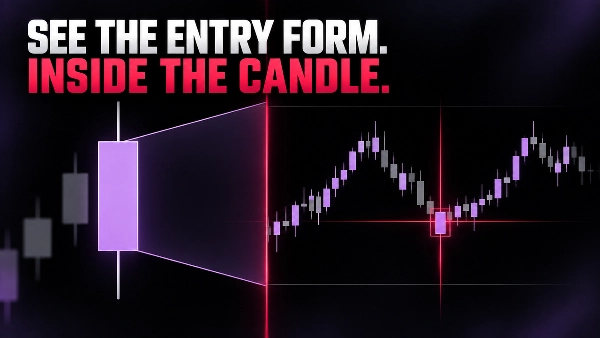
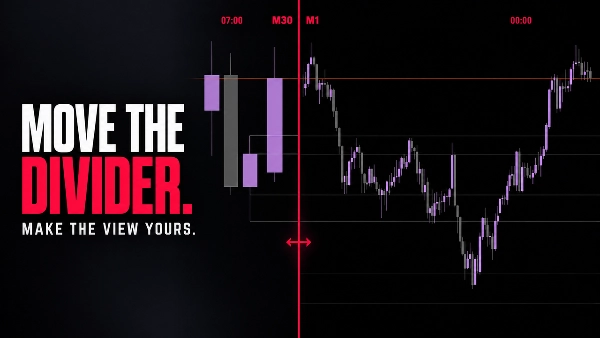
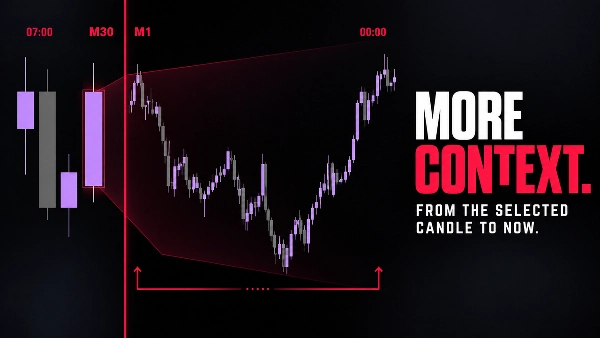
TradeLens วางมุมมองแท่งเทียนช่วงเวลาสั้นแบบกะทัดรัดไว้ภายในกราฟปัจจุบันของคุณ กราฟต้นฉบับยังคงเป็นบริบทช่วงเวลาที่ยาวกว่า; แผงรายละเอียดแสดงให้เห็นว่าราคาพัฒนาอย่างไรภายในแท่งเทียนบริบทที่เลือก

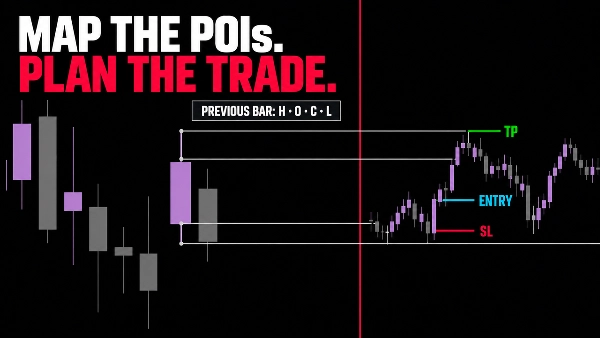
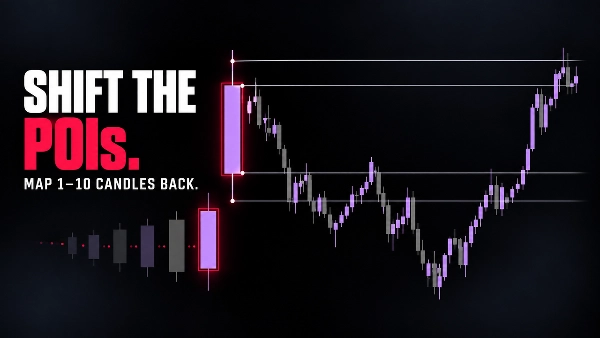
ใช้แท่งเทียนที่กำลังสร้างขึ้นในปัจจุบันเป็นค่าเริ่มต้น หรือเลื่อนกลับไปตรวจสอบแท่งเทียนบริบทก่อนหน้า คุณสามารถกำหนดกรอบการตั้งค่าที่ใช้งานด้วย POI (รังสี) ที่ระดับสูง ต่ำ เปิด และปิดของแท่งเทียนที่ปิดก่อนหน้า จากนั้นศึกษาการเคลื่อนไหวช่วงเวลาสั้นโดยไม่ต้องออกจากกราฟ

สิ่งที่ TRADELENS ช่วยให้คุณเห็น

  • โครงสร้างช่วงเวลาที่ยาวกว่าและรายละเอียดช่วงเวลาที่สั้นกว่าในหน้าต่างเดียวกัน
  • ความก้าวหน้าของแท่งเทียนบริบทปัจจุบันในระดับที่ละเอียดขึ้น
  • จุดสนใจ OHLC ของแท่งเทียนก่อนหน้าทั่วทั้งกราฟ
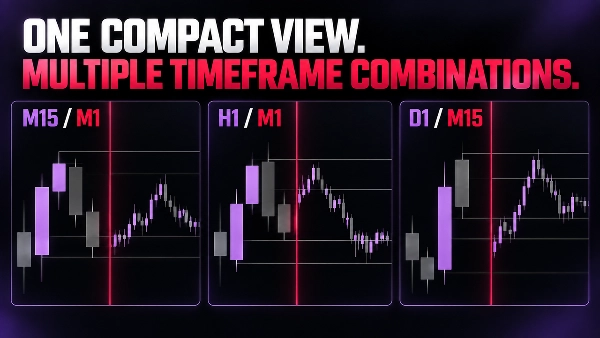
  • การผสมผสานแบบกะทัดรัด เช่น M15/M1, M30/M1, H1/M1, D1/M15 และ D1/M30
  • วิธีที่สะอาดขึ้นในการปรับเวลาการเข้าซื้อขายในขณะที่รักษาบริบท
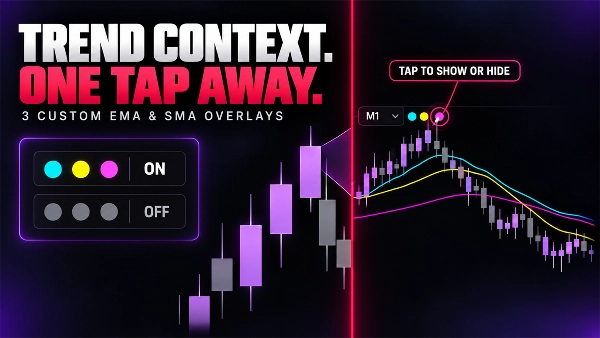
  • เพิ่มชั้น EMA หรือ SMA ที่ปรับแต่งได้สูงสุดสามชั้น
  • แสดงหรือซ่อนค่าเฉลี่ยแต่ละค่าได้ทันทีด้วยการควบคุมแบบแตะครั้งเดียว
  • ดูทิศทางแนวโน้มได้โดยตรงภายในมุมมองช่วงเวลาสั้น

การควบคุมที่เรียบง่ายและมองเห็นได้

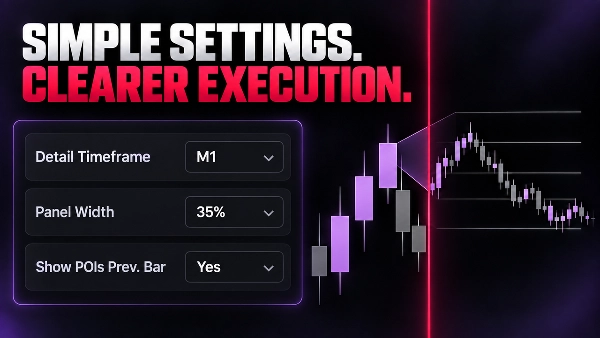
  • ช่วงเวลารายละเอียดและการเลื่อนแท่งเทียนบริบท
  • ความกว้างของแผงรายละเอียด, พื้นหลัง และความทึบแสง
  • สีของกระทิง, หมี, ตัวคั่น และป้ายชื่อ
  • POI ของแท่งเทียนก่อนหน้าที่เป็นทางเลือกพร้อมสีและความหนาที่กำหนดค่าได้

ช่วงเวลารายละเอียดต้องเล็กกว่าช่วงเวลาของกราฟ หากการผสมผสานไม่ถูกต้อง TradeLens จะซ่อนการแสดงผลและแสดงแบนเนอร์การตั้งค่าที่ชัดเจน

TradeLens เป็นเครื่องมือวิเคราะห์เชิงภาพ ไม่ได้วาง แก้ไข หรือจัดการคำสั่ง ตัวอย่างที่แสดงในแกลเลอรีแสดงขั้นตอนการอ่านกราฟและไม่ใช่คำแนะนำการซื้อขายหรือการรับประกันผลการดำเนินงาน


สรุป

สรุปโดย AI
TradeLens is a chart visualization tool designed to integrate two timeframes within a single trading chart. It embeds a compact lower-timeframe candle view inside the current higher-timeframe chart, allowing traders to observe detailed price action within the context of a broader market structure. Users can analyze the progression of the current or previous context candles at a finer scale without switching charts.

Key features include optional points of interest (POIs) marking the previous bar’s Open, High, Low, and Close levels, customizable visual settings such as detail panel size, background opacity, and color schemes for bullish, bearish, and separator elements. TradeLens supports common timeframe combinations like M15/M1, M30/M1, H1/M1, D1/M15, and D1/M30, ensuring the detail timeframe is always smaller than the context timeframe.

This tool facilitates refined entry timing by preserving higher-timeframe context while providing granular lower-timeframe insights. It is a visual analysis indicator and does not execute or manage trades. TradeLens is tagged under market structure and chart UI tools, supporting analysis related to key levels, liquidity sweeps, market structure changes, and inducements.
โปรไฟล์อินดิเคเตอร์
หมวดหมู่อินดิเคเตอร์
โครงสร้างตลาด (SMC)
ประเภทเอาต์พุต
การแสดงเป็นภาพ
ข้อกำหนดด้านข้อมูล
แท่งเท่านั้น

การสนทนา

รีวิวจากลูกค้า

4.5
รีวิว: 4
5
50 %
4
50 %
3
0 %
2
0 %
1
0 %
รีวิวจากลูกค้า
October 24, 2026
smaller candles inside the larger one are an elegant way to retain the path within the wider move, with optional previous OHLC giving the comparison useful reference points instead of adding entry signals.
October 8, 2026
M1 candles inside an H1 candle keep the little moves and the bigger picture together. Previous OHLC can be added when needed. A handy comparison overlay, with the detail period required to stay smaller than the context period.
October 4, 2026
TradeLens displayed an embedded M1 candle view on EURUSD H1 and XAUUSD H1, M10 and Month1. Three moving averages, timeframe labels and the separator were visible. The invalid M1/M1 combination correctly triggered a clear warning. The interface works well, although low contrast and compressed detail candles can affect readability, especially on higher timeframes.
October 2, 2026
keeping M1 detail inside H1 context is a useful comparison view, with optional previous OHLC references and a clear requirement for the detail period to remain smaller than the larger candle.

คำถามที่พบบ่อย

Chart UI Tools
Key Levels
Liquidity Sweep
CHOCH
Inducement
Market Structure
Liquidity Grab
ผลิตภัณฑ์ที่มีให้บริการผ่าน cTrader Store รวมถึงบอทการเทรด อินดิเคเตอร์ และปลั๊กอิน มีให้บริการโดยนักพัฒนาบุคคลที่สามและมีไว้เพื่อวัตถุประสงค์ในการเข้าถึงข้อมูลและทางเทคนิคเท่านั้น cTrader Store ไม่ใช่โบรกเกอร์และไม่ได้ให้คำแนะนำการลงทุน คำแนะนำส่วนบุคคล หรือการรับประกันผลการดำเนินงานในอนาคต

เพิ่มเติมจากผู้เขียนคนนี้

อินดิเคเตอร์
BOS
CHOCH
+5
Spot market structure shift with ease, overlay timeframes, avoid false breakouts with open close pivots, hide chart bars
"BubbleXRay" โลโก้
ยอดนิยม
4.3
(3)
$19
/
$29
อินดิเคเตอร์
Volume
Imbalance
+5
Spot Institutional Order Flow with Proportional Volume Bubbles & Integrated Cumulative Volume Delta (CVD) Intelligence.
"FimatheViewer" โลโก้
ยอดนิยม
4.6
(3)
$19
/
$29
อินดิเคเตอร์
Forex
EURUSD
+5
Fimathe Indicator - Fimathe PCM - Automated Trend Channels & Levels — Ideal for live trading and backteting
"ZigXRay" โลโก้
เรตติ้งสูง
4.6
(5)
$29
/
$49
อินดิเคเตอร์
CHOCH
Key Levels
+5
ZigZag Market Structure Identifier - Multi-Layer Scanner: Convergent Pivot Detection, 4-TF Overlay & Naked Chart Mode.
ปลั๊กอินเดสก์ท็อป
Risk/Reward
Trade Journal
+5
cTrader Journal - Automatic Trade Capture. Offline Reviews. No Subscription.
"DrbcLevels" โลโก้
เรตติ้งสูง
4.0
(4)
$19
/
$29
อินดิเคเตอร์
Key Levels
Break & Retest
+5
Premium Discount Levels - Professional Dealing Range Zones with Draggable Lines, Alerts, Wartermark & Backtest Mode.
cBot
Fixed Lot
TP Manager
+5
Hotkeys Trading Assistant - Professional Shortcut Assitant with Risk Manager, Hotkeys & Lot Sizing.
"fvg_levels" โลโก้
เรตติ้งสูง
4.0
(4)
$19
/
$29
อินดิเคเตอร์
Key Levels
Order Block
+5
FVG Levels — Auto-Detection of Multi-Timeframe Fair Value Gaps & GAPs, Smart Filters and Liquidity Zone Monitoring

นอกจากนี้คุณยังอาจชอบ

อินดิเคเตอร์
Forex
Crypto
+5
The best filter for trading trend continuations on Renko charts.
อินดิเคเตอร์
Forex
EURUSD
+3
ATR-normalized MA slope in degrees, comparable across all instruments. Color-coded labels flag strong trend moves.
อินดิเคเตอร์
ATR
BTCUSD
+5
Multi-pole Gaussian filter channel with dynamic color, Reduced Lag & Fast Response modes. Port of DonovanWall's original
อินดิเคเตอร์
Market Structure
Support & Resistance
Auto-centers price when it moves beyond threshold. Adjustable zoom. Works on any chart type. Never lose price again.
"FimatheViewer" โลโก้
ยอดนิยม
4.6
(3)
$19
/
$29
อินดิเคเตอร์
Forex
EURUSD
+5
Fimathe Indicator - Fimathe PCM - Automated Trend Channels & Levels — Ideal for live trading and backteting
อินดิเคเตอร์
ADX
ATR
+2
GOLD SENTINEL v1.0 - A CANDLE-COLORING INDICATOR FOR GOLD.
อินดิเคเตอร์
Doji
Volume
+5
Instantly spot high-liquidity institutional moves with clean, non-obtrusive triangle alerts on cTrader charts.
"TMAX RBA 2026 ULTRA" โลโก้
ยอดนิยม
4.5
(6)
$20
/
$25
อินดิเคเตอร์
Forex
BTCUSD
+7
🚀 TMAX RBA Indicator - The Ultimate Multi-Timeframe Momentum System 🚀
อินดิเคเตอร์
Order Block
Breaker Block
+5
Unicorn Model ICT Indicator — Smart Trading with Precision
อินดิเคเตอร์
ATR
Volume
+3
Volume profile key levels - POC, value area, volume peaks and troughs - with break, rejection and retest signals
อินดิเคเตอร์
EURUSD
GBPUSD
+3
All-in-one suite for ICT concepts: NY Midnight Open, Killzones, automatic Liquidity levels (PDH/L, PWH/L).
อินดิเคเตอร์
XAUUSD
Professional Volume Profile Indicator - Shows volume distribution, POC, Value Areas & Buy/Sell pressure.
อินดิเคเตอร์
Fair Value Gap
Liquidity Grab
+2
PRO Liquidity Sweep + FVG Combo detector with custom Gold/Blue signals & alerts
อินดิเคเตอร์
ATR
EMA
+4
Range-filter BUY/SELL signals scored by four confluence layers, with a stop, five targets and a trend panel
"Reverse RSI Phantom" โลโก้
เรตติ้งสูง
4.5
(4)
$29
/
$47
อินดิเคเตอร์
ATR
RSI
+4
RSI bands drawn on price, confluence-scored BUY/SELL signals, an ATR stop with three targets
อินดิเคเตอร์
Volume
Support & Resistance
Compare up to 27 symbols across eight timeframes with seven analysis engines and an interactive cTrader dashboard.
อินดิเคเตอร์
BB Breakout Oscillator with alerts! Spot trend reversals using Bollinger Bands. Bullish/Bearish crossovers Alerts.
อินดิเคเตอร์
Drawdown Monitor
Proprietary trading desk risk monitoring dashboard!

ราคา

ตั้งแต่ 09/02/2026
29
การขาย
179
ติดตั้งฟรี