present
ลงทะเบียนและรับส่วนลด $50 สำหรับการซื้อครั้งแรกของคุณ
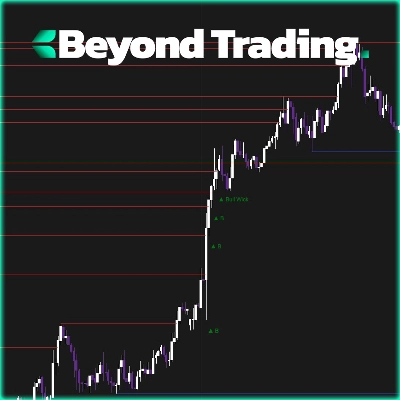
Trading product for Multi EMA Timeframes อินดิเคเตอร์ EMA AI-assisted, image 1
Multi EMA Timeframes
อินดิเคเตอร์
1 การซื้อ
เวอร์ชัน 1.0, Apr 2026
Windows, Mac
4.3
รีวิว: 3
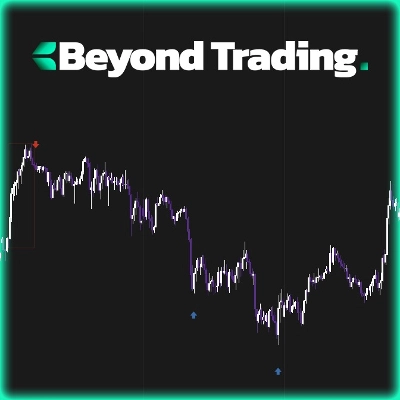
Trading product for Multi EMA Timeframes อินดิเคเตอร์ EMA AI-assisted, image 2
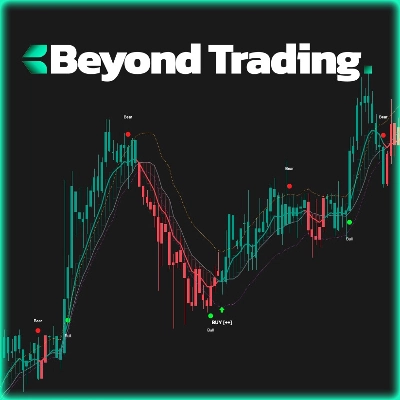
Trading product for Multi EMA Timeframes อินดิเคเตอร์ EMA AI-assisted, image 3
ตั้งแต่ 21/01/2026
4
การขาย
200
ติดตั้งฟรี

คำอธิบาย

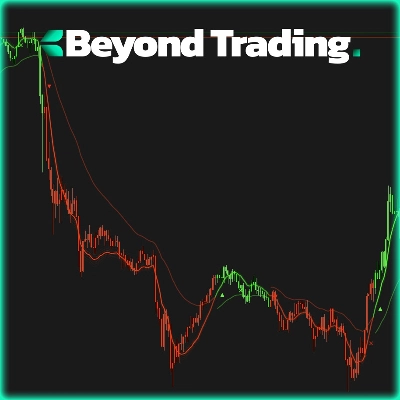
Multi EMA Timeframes by [BeyondTrading] ความผิดพลาดที่พบบ่อยที่สุดที่เทรดเดอร์ทำกับค่าเฉลี่ยเคลื่อนที่คือการเปลี่ยนกรอบเวลาเพียงเพื่อตรวจสอบว่า EMA สำคัญอยู่ที่ไหน Multi EMA Timeframes กำจัดปัญหานั้นโดยสิ้นเชิง คุณยังคงอยู่ในกรอบเวลาทำงานของคุณ — 5 นาที, 15 นาที, 1 ชั่วโมง — และคุณกำหนดได้อย่างชัดเจนว่า EMA ใดจากกรอบเวลาใดควรปรากฏบนชาร์ตของคุณในตอนนี้ โดยไม่ต้องย้ายไปที่อื่น

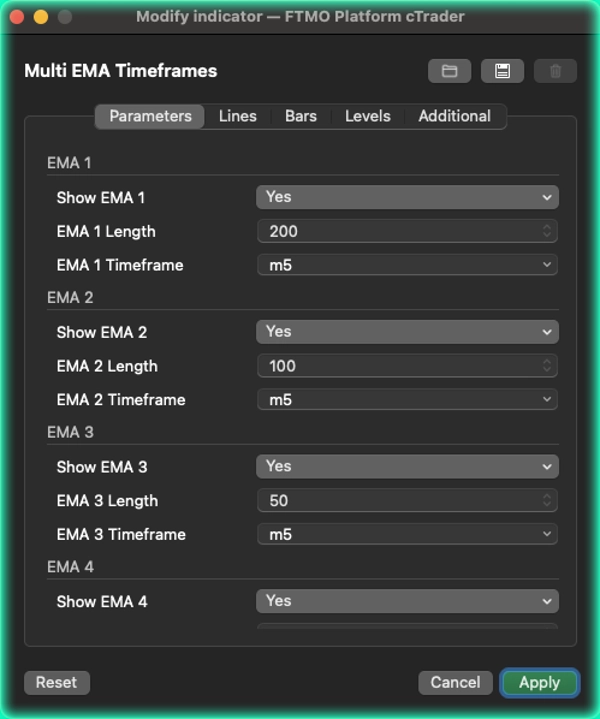
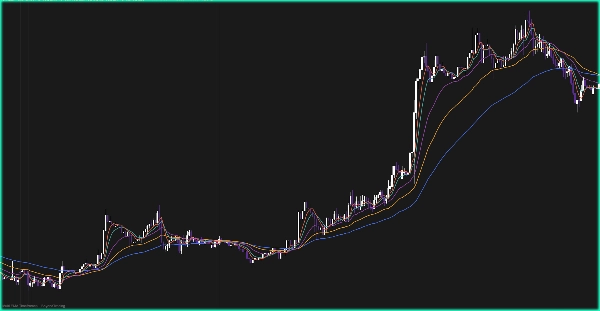
คุณอยู่บนชาร์ต 5 นาทีและต้องการดู EMA 200 จากกรอบเวลา 1 ชั่วโมง? เสร็จแล้ว คุณยังต้องการ EMA 50 จาก 15 นาทีและ EMA 20 จากกรอบเวลาปัจจุบันแสดงเคียงข้างกันด้วยหรือ? ก็ทำได้เช่นกัน EMA ทั้งห้าตัวแต่ละตัวถูกตั้งค่าอย่างอิสระ: ช่วงเวลาของตัวเอง, กรอบเวลาที่มาแหล่งข้อมูลของตัวเอง, สีของตัวเอง และสวิตช์เปิด/ปิดของตัวเอง

นี่เป็นประโยชน์อย่างยิ่งสำหรับการตั้งค่าความสอดคล้อง เมื่อราคาบนกรอบเวลาเข้าซื้อของคุณเข้าใกล้ EMA ที่มาจากกรอบเวลาที่สูงกว่า ระดับนั้นมีน้ำหนักโครงสร้างที่แท้จริง การเห็นมันโดยตรงบนชาร์ตของคุณ — โดยไม่ต้องสลับแท็บ, โดยไม่ต้องเดาค่าที่แน่นอน — เปลี่ยนวิธีที่คุณโต้ตอบกับโซนสำคัญเหล่านั้น

โหมดการแสดงผลสองแบบช่วยให้คุณควบคุมวิธีการวาดเส้น โหมดขั้นบันไดจะล็อกแต่ละ EMA ที่แท่งข้อมูลต้นทางที่ปิดสมบูรณ์ล่าสุด ดังนั้นค่าจะไม่เปลี่ยนจนกว่าแท่งข้อมูลกรอบเวลาที่สูงกว่าจะปิด — ไม่มีการวาดซ้ำ, เชื่อถือได้เต็มที่สำหรับการตัดสินใจเทรดสด โหมดเรียบจะคำนวณค่าระหว่างแท่งข้อมูลต้นทางอย่างต่อเนื่องเพื่อภาพที่สะอาดตา เหมาะสำหรับการวิเคราะห์และทบทวน

สิ่งที่ทำให้แตกต่าง ตัวบ่งชี้ multi-EMA ส่วนใหญ่คำนวณทุกอย่างบนกรอบเวลาปัจจุบันของชาร์ต ที่นี่แต่ละ EMA มาจากกรอบเวลาที่เป็นอิสระของตัวเองจริงๆ คุณไม่ได้ประมาณค่า — คุณกำลังอ่าน EMA จริงที่เทรดเดอร์ในกรอบเวลานั้นเห็นจริงๆ

คุณสมบัติ

  • สูงสุด 5 EMA ที่เป็นอิสระเต็มที่ แต่ละตัวมีกรอบเวลาและช่วงเวลาของตัวเอง
  • อยู่บนกรอบเวลาใดก็ได้ในชาร์ตในขณะที่อ่าน EMA จากกรอบเวลาอื่นๆ
  • โหมดขั้นบันได: ค่าล็อกกับแท่งข้อมูลต้นทางที่ปิดแล้ว ไม่มีการวาดซ้ำ
  • โหมดเรียบ: การคำนวณเชิงเส้นเพื่อการเปลี่ยนภาพที่ลื่นไหล
  • สวิตช์แสดง/ซ่อนต่อ EMA เพื่อให้ชาร์ตของคุณสะอาดอยู่เสมอ

สรุป

สรุปโดย AI
Multi EMA Timeframes is a trading indicator that displays up to five independent exponential moving averages (EMAs) from different timeframes on a single chart. It allows traders to remain on their current chart timeframe—such as 5-minute, 15-minute, or 1-hour—while viewing EMAs calculated from other timeframes without switching views. Each EMA can be customized individually with its own period, source timeframe, color, and visibility toggle.

The indicator supports two rendering modes: Step mode, which locks EMA values to the last fully closed bar of the source timeframe to avoid repainting and ensure reliability for live trading; and Smooth mode, which interpolates values between bars for a visually smoother display suited for analysis. This functionality enables traders to identify confluence zones where EMAs from higher timeframes intersect with price action on the current timeframe, providing structural context directly on the chart.

By sourcing each EMA from its true timeframe rather than approximating values on the current timeframe, Multi EMA Timeframes offers precise and actionable moving average data to support multi-timeframe analysis and decision-making.
โปรไฟล์อินดิเคเตอร์

รีวิวจากลูกค้า

4.3
รีวิว: 3
5
33 %
4
67 %
3
0 %
2
0 %
1
0 %
รีวิวจากลูกค้า
April 29, 2026
Two timeframes give more context. One quick look should not become the whole decision.
April 24, 2026
April 15, 2026
Signal count matters more than one nice example, and the trade idea gets a pause before execution.

การสนทนา

คำถามที่พบบ่อย

EMA
AI-assisted
Moving Average
ผลิตภัณฑ์ที่มีให้บริการผ่าน cTrader Store รวมถึงบอทการเทรด อินดิเคเตอร์ และปลั๊กอิน มีให้บริการโดยนักพัฒนาบุคคลที่สามและมีไว้เพื่อวัตถุประสงค์ในการเข้าถึงข้อมูลและทางเทคนิคเท่านั้น cTrader Store ไม่ใช่โบรกเกอร์และไม่ได้ให้คำแนะนำการลงทุน คำแนะนำส่วนบุคคล หรือการรับประกันผลการดำเนินงานในอนาคต

เพิ่มเติมจากผู้เขียนคนนี้

อินดิเคเตอร์
BOS
Key Levels
+3
Pivot-based Support and Resistance levels that extend until broken, with volume-confirmed break signals
"Sessions" โลโก้
ยอดนิยม
5.0
(4)
$19
/
$29
อินดิเคเตอร์
Prop
Forex
+5
Tracks NY, London, Tokyo, Sydney sessions with custom visuals, and a real-time expanding range box and breakout High/Low
อินดิเคเตอร์
EMA
SMA
+2
Exhaustion Hunter by BeyondTrading — When price hits the limit, the reversal is next.
อินดิเคเตอร์
Key Levels
Supertrend
+3
Reversal Hunter by BeyondTrading — Stop guessing direction. Catch the turn before the crowd.
"ATR Ratio SuperTrend" โลโก้
เรตติ้งสูง
4.2
(4)
$19
/
$29
อินดิเคเตอร์
Prop
Forex
+5
ATR Ratio SuperTrend show Trend & volatility combined. Clean arrows, built-in Take Profit.
อินดิเคเตอร์
ATR
EMA
+2
Adaptive Entropy Trend reads market randomness to filter noise from direction. Smooth trend line, automatic bar coloring
อินดิเคเตอร์
ATR
EMA
+4
Reads trend acceleration, not just direction. Glowing lead line, dynamic channel, auto flip levels.
อินดิเคเตอร์
RSI
VWAP
+3
Asia, London & NY sessions mapped in real time, boxes, VWAP, kill zones, range extensions, and a built-in RSI panel.

นอกจากนี้คุณยังอาจชอบ

"Two Candle Patterns " โลโก้
เรตติ้งสูง
4.5
(7)
$19
/
$35
อินดิเคเตอร์
Forex
Crypto
+3
Detect powerful 2-candle reversal patterns at key highs/lows. Boost entries with real-time alerts and visual signals.
อินดิเคเตอร์
Fibonacci
Key Levels
+5
Institutional Nasdaq-100 Auto-Fib Playbook for cTrader. Dynamic ICT 70.5% OTE Engine, NY Session Tracker, Real-Time Poin
"heatmap kopie" โลโก้
เรตติ้งสูง
4.2
(4)
$19
/
$29
อินดิเคเตอร์
AI
SMC
+13
Dynamic Liquidity Depth exposes hidden volume
"ORB v1.1" โลโก้
ยอดนิยม
4.0
(4)
$25
อินดิเคเตอร์
Breakout
Opening Range Breakout v1.1 - Visuals + Stats
อินดิเคเตอร์
Triangle
Double Top
+5
Know which liquidity sweeps are real. Auto-tracks EQH/EQL and confirms genuine reversals, not just broken levels.
"Liquidity Edge" โลโก้
ยอดนิยม
4.5
(4)
$19
/
$29
อินดิเคเตอร์
Imbalance
Inside Bar
+3
A clean and powerful Smart Money Concepts tool combining Fair Value Gaps, Previous Daily High/Low, Inside/Outside bar
อินดิเคเตอร์
RSI
BTCUSD
+5
Identify market structure effortlessly with swing highs, lows, CHoCH, and BOS levels for smart trading decisions! 📊🔍"
อินดิเคเตอร์
Prop
Forex
+5
🎯 Order Block Detector - Smart Trading: Identifica bloques de órdenes clave en cTrader para un trading más inteligente.
อินดิเคเตอร์
Key Levels
Liquidity Sweep
Professional Opening Range Breakout, Initial Balance, False breakout Detection
อินดิเคเตอร์
VWAP
Forex
+13
Custom VWAP Indicator for cTrader
อินดิเคเตอร์
AI
ATR
+27
An advanced VWAP with multi-VWAP (Daily/Weekly/Monthly/Anchored), click-to-anchor, configurable alerts, a stats panel,
"Candles_Painter" โลโก้
ยอดนิยม
4.6
(3)
$19
อินดิเคเตอร์
Overlay HTF context on any chart: color bars by HTF and draw filled HTF bodies with optional High/Low lines.
อินดิเคเตอร์
Supply & Demand
Support & Resistance
RAF Supply Demand Lite v1.0 automatically detects clean Supply and Demand zones using confirmed swing highs and lows. Zo
อินดิเคเตอร์
BOS
CHOCH
+5
A professional-grade cTrader indicator for traders following the Inner Circle Trader (ICT) methodology.
"Auto Signal Buy-Sell" โลโก้
ยอดนิยม
4.3
(3)
$19
อินดิเคเตอร์
MACD
Forex
+6
Auto Signal BUY SELL is a professional decision-making tool designed to help you follow the trend and capture high-proba
อินดิเคเตอร์
Spread Filter
SpreadSync Entry Timer is a compact cTrader indicator that shows live spread and candle-close.
อินดิเคเตอร์
Key Levels
Liquidity Grab
+2
A practical XAUUSD workspace for mapped levels, session context, liquidity events, alerts and risk planning.
"Break of Structure" โลโก้
ยอดนิยม
4.7
(4)
$19
/
$25
อินดิเคเตอร์
The Break of Structure (BoSCHoCh) Indicator is a smart market structure tool designed to help traders easily spot trend.

ราคา

ตั้งแต่ 21/01/2026
4
การขาย
200
ติดตั้งฟรี