
Descripción del Indicador:
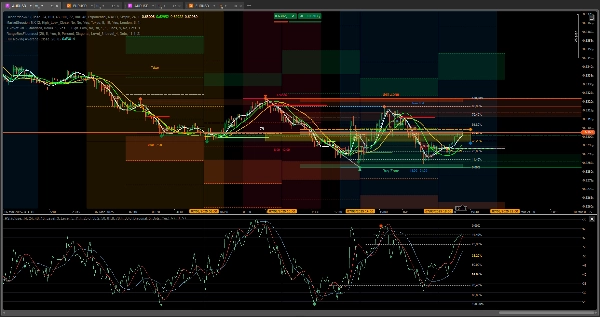
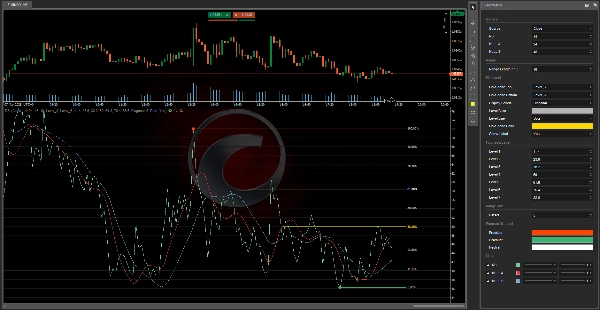
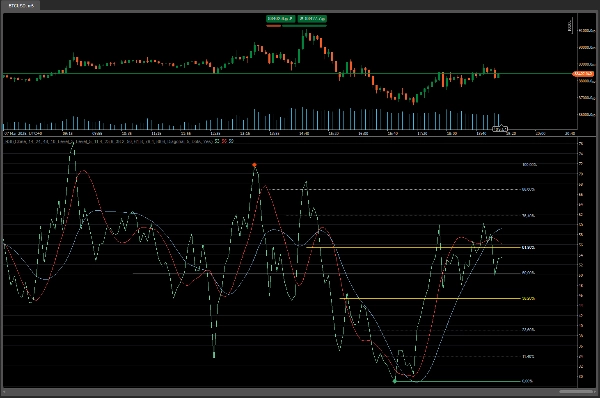
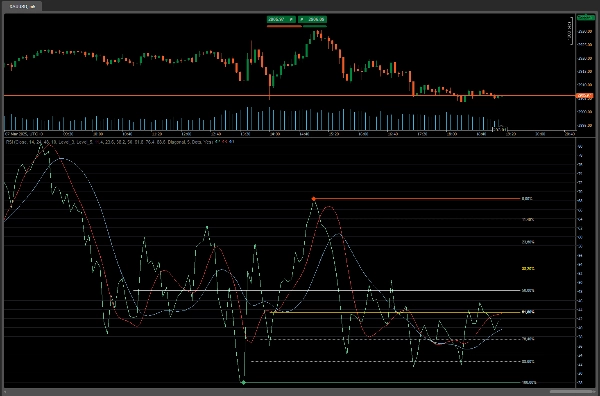
🎯 Indicador RSI con Niveles de Fibonacci y Medias Móviles Hull 🚀
¿Quieres llevar tu análisis técnico al siguiente nivel? ¡Este indicador es para ti! Combina lo mejor de tres herramientas poderosas: el RSI (Índice de Fuerza Relativa), Niveles de Fibonacci, y Medias Móviles Hull para proporcionarte una visión completa y precisa del mercado.
Características Clave:
- RSI con Niveles de Fibonacci:
-
- Identifica zonas clave de soporte y resistencia basadas en niveles de Fibonacci.
- Ayuda a detectar posibles reversiones y continuaciones con mayor precisión.
- Medias Móviles Hull:
-
- Incluye dos Medias Móviles Hull (Hull A y Hull B) para filtrar el ruido del mercado y capturar tendencias de manera más eficiente.
- Proporciona señales claras de entrada y salida basadas en cruces y cambios de dirección.
- Zonas de Cambio de Tendencia:
-
- Destaca áreas críticas donde es probable que ocurran cambios de tendencia, ayudándote a anticipar movimientos significativos.
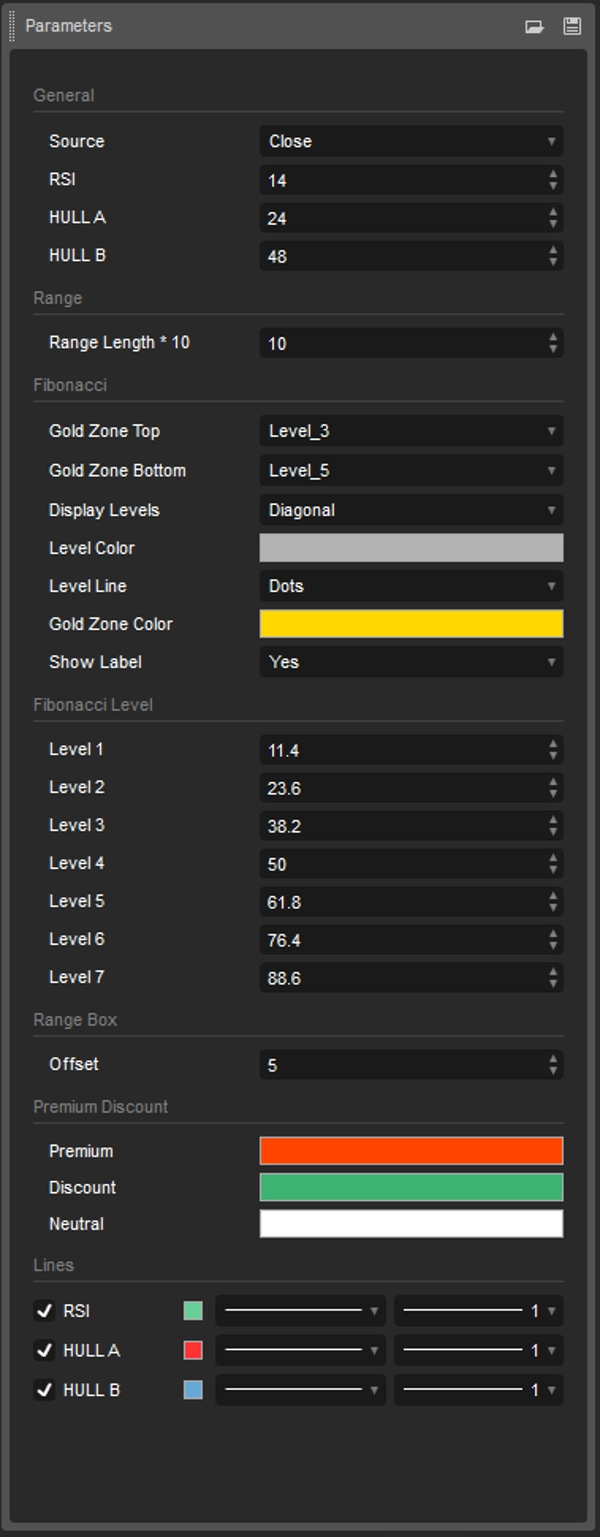
- Personalización Completa:
-
- Ajusta los niveles de Fibonacci, colores y estilos de línea según tus preferencias.
- Configura las Medias Móviles Hull para adaptarlas a tu estrategia de trading.
- Visualización Clara:
-
- Iconos y líneas de tendencia bien definidas para una interpretación rápida y sencilla.
- Etiquetas opcionales para mostrar los niveles de Fibonacci en porcentajes.
Beneficios para los Traders:
- Mayor Precisión: Combina RSI con niveles de Fibonacci y Medias Móviles Hull para señales más confiables.
- Ahorro de Tiempo: No necesitas superponer múltiples indicadores; todo está integrado en una sola herramienta.
- Versatilidad: Funciona en cualquier marco temporal y mercado (forex, acciones, criptomonedas, etc.).
- Facilidad de Uso: Diseñado para traders de todos los niveles, desde principiantes hasta expertos.
¿Por Qué Descargar Este Indicador?
- Innovador: Una combinación única de herramientas clásicas y modernas que no encontrarás en otros indicadores.
- Efectivo: Te ayuda a identificar oportunidades de trading con mayor claridad y confianza.
Cómo Usarlo:
- Identifica la Tendencia: Usa las Medias Móviles Hull para determinar la dirección del mercado.
- Busca Señales RSI: Verifica si el RSI está en condiciones de sobrecompra o sobreventa cerca de los niveles de Fibonacci.
- Confirma con Fibonacci: Usa los niveles de Fibonacci para identificar zonas clave de soporte y resistencia.
- Toma Decisiones Informadas: Entra o sal de operaciones con mayor confianza basándote en señales claras y precisas.
¡Descarga Ahora y Mejora Tu Trading!
No pierdas más tiempo analizando gráficos manualmente. Con este indicador, tendrás todo lo que necesitas en un solo lugar. ¡Haz tu trading más eficiente y rentable!
Y con dos herramientas puedes dejar de preocuparte por lo que el mercado va a hacer, con una simple mirada sabrás – comprar o vender y pasar a otra tarea.
RangeBoxFibonacci: https://ctrader.com/products/526?u=VIZAINT
OrderPrice-V3: https://ctrader.com/products/397?u=VIZAINT
Y para elegir
NTMPICLL https://ctrader.com/products/327?u=VIZAINT
MacdVolume https://ctrader.com/products/267?u=VIZAINT
MarketSession-MX: https://ctrader.com/products/525?u=VIZAINT
5 | 100 % | |
4 | 0 % | |
3 | 0 % | |
2 | 0 % | |
1 | 0 % |


