
Description
Cet indicateur VIX propriétaire, alimenté par l'Average True Range (ATR), offre une analyse précise et claire de la volatilité du marché, optimisée pour cTrader 5.5.13+. Il combine le mouvement VIX mis à l'échelle avec l'analyse du volume pour confirmer les changements majeurs et les cassures potentielles.
Fonctionnalités clés & Qualité du code
- Zéro bugs/avertissements : Entièrement refactorisé selon la dernière API cTrader, éliminant toutes les erreurs et avertissements hérités pour une stabilité et des performances maximales.
- VIX basé sur l'ATR : Fournit une mesure réactive de la volatilité, normalisée pour détecter les conditions extrêmes du marché.
- Double confirmation : Utilise la volatilité (ligne VIX) combinée aux données de volume de ticks pour valider les alertes de cassure à haute probabilité.
Personnalisez votre configuration pour un maximum d'informations
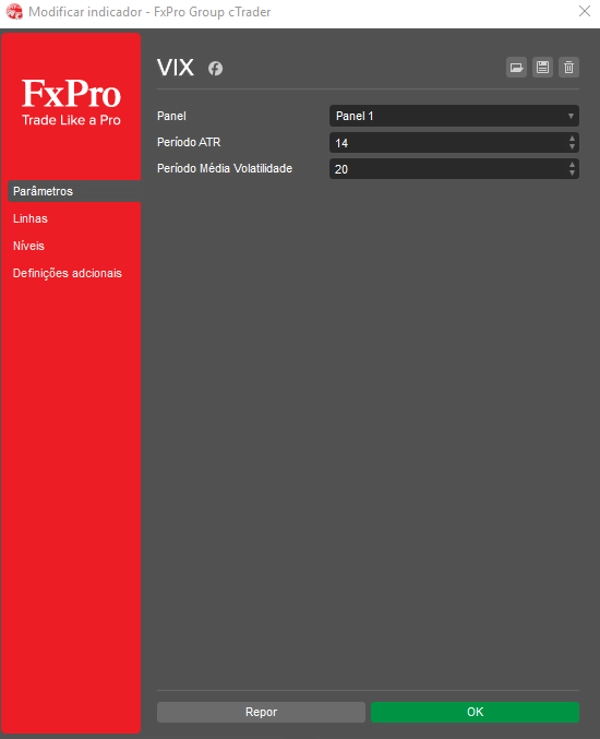
Ajustez facilement l'indicateur pour correspondre à votre stratégie de trading en définissant les valeurs souhaitées pour Niveau VIX bas et Niveau VIX haut. De plus, ajustez le Facteur d'échelle VIX pour contrôler précisément la hauteur et la visualisation de la ligne VIX dans le panneau inférieur.
Comment lire les signaux de cassure & de consolidation
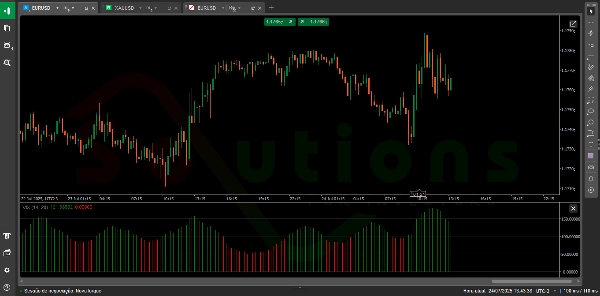
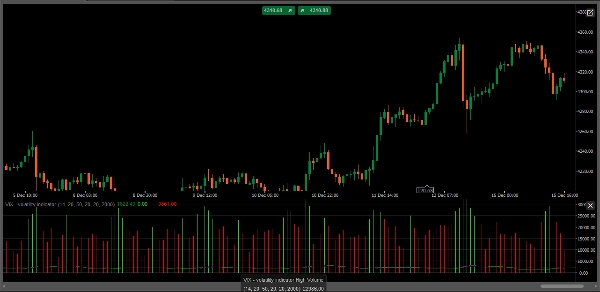
- Alerte de cassure (haute volatilité) : Lorsque la ligne VIX dépasse fortement le Niveau VIX haut ET est accompagnée d'un volume élevé (indiqué par l'histogramme Volume élevé), cela confirme une peur/avidité extrême et signale une cassure de marché à haute probabilité.
- Signal de consolidation (basse volatilité) : Lorsque la ligne VIX tombe en dessous du Niveau VIX bas, cela indique souvent une période de calme sur le marché, une consolidation serrée ou une possible réversion vers la moyenne — idéal pour préparer votre prochain mouvement ou réduire le risque.
- Informations sur le volume : L'indicateur trace les histogrammes de Volume élevé (vert) et Volume faible (rouge) en arrière-plan, vous permettant d'évaluer instantanément la liquidité et la conviction derrière l'action de prix actuelle.
Résumé
Key features include:
- ATR-based VIX calculation for responsive volatility measurement normalized to detect extreme market conditions.
- Volume analysis with high (green) and low (red) volume histograms to assess liquidity and conviction behind price movements.
- Customizable parameters allowing users to set Low VIX Level and High VIX Level thresholds, as well as adjust the VIX Scale Factor for optimal visualization.
Usage signals:
- A breakout alert occurs when the VIX line surpasses the High VIX Level accompanied by high volume, indicating potential market breakouts driven by extreme fear or greed.
- A consolidation signal is identified when the VIX falls below the Low VIX Level, suggesting periods of low volatility, market calm, or potential mean reversion.
This indicator supports analysis across various markets including Forex, indices, commodities, stocks, and cryptocurrencies.
Avis clients
5 | 50 % | |
4 | 50 % | |
3 | 0 % | |
2 | 0 % | |
1 | 0 % |


