
Description
RSI personnalisé – Renversements précis et visuels épurés
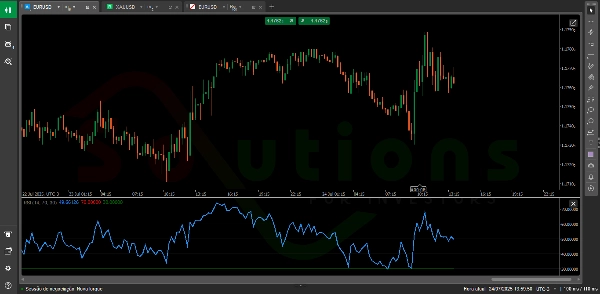
RSI personnalisé est une version améliorée de l’Indice de Force Relative (RSI) classique, conçue pour aider les traders à identifier rapidement les zones de surachat et de survente — des zones clés où le prix est susceptible de se retourner.
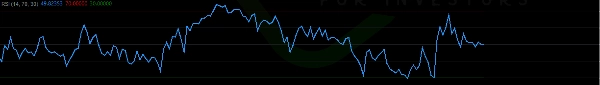
Avec une interface claire et intuitive, il affiche deux lignes horizontales entièrement personnalisables (comme les niveaux traditionnels 70 et 30), marquant clairement les points de décision à haute probabilité sur le graphique.
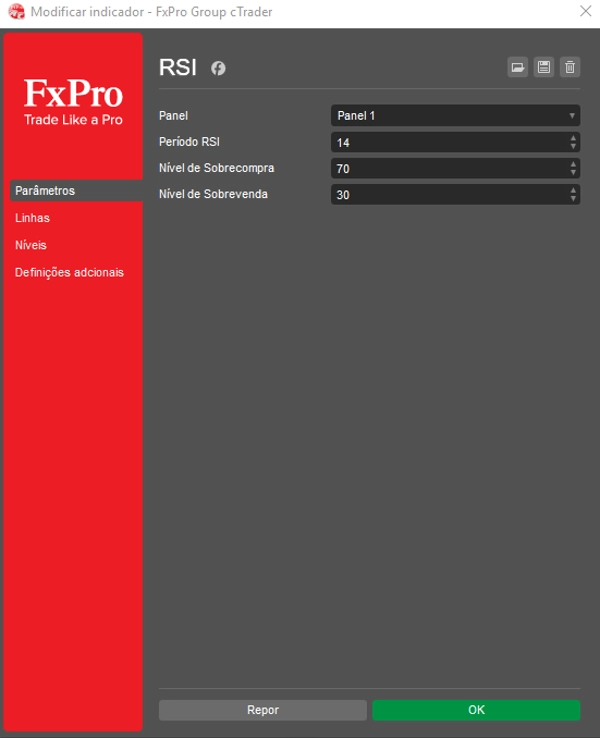
✅ Ajustez la période et les niveaux RSI selon votre style de trading
✅ Identifiez les zones potentielles de renversement avec plus de confiance
✅ Améliorez votre analyse technique avec un indicateur clair et sans encombrement
Parfait pour les traders de tous niveaux, RSI personnalisé transforme les données brutes de prix en informations intelligentes et exploitables — en faisant un outil essentiel pour une prise de décision rentable.
Résumé
Avis clients
5 | 0 % | |
4 | 100 % | |
3 | 0 % | |
2 | 0 % | |
1 | 0 % |


