
Description
CE QUE CELA FAIT
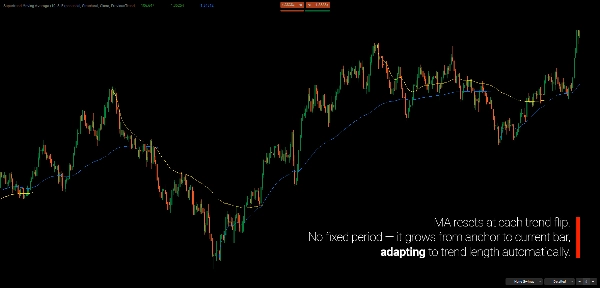
La Moyenne Mobile Supertrend répond à une limitation fondamentale des moyennes mobiles traditionnelles : des périodes fixes qui ne s’adaptent jamais à la façon dont les tendances se développent réellement.
Les périodes courtes réagissent rapidement mais sont sujettes aux faux signaux. Les périodes longues lissent le bruit mais accusent un fort retard lors de mouvements puissants. Quelle que soit la configuration, vous êtes obligé de deviner un nombre et d’espérer que le marché coopère.
Cet indicateur élimine cette incertitude.
Au lieu de faire la moyenne des prix sur un nombre arbitraire de barres, il calcule la moyenne mobile à partir du moment où la tendance actuelle commence structurellement. Plus la tendance dure, plus la MM devient naturellement longue. Les tendances courtes restent réactives. Les tendances prolongées deviennent plus lisses — automatiquement.
Le résultat est une moyenne mobile qui grandit avec la tendance, et non contre elle.
Ancrée aux changements structurels basés sur Supertrend, cette MM s’adapte au rythme du marché en temps réel, sans optimisation, ajustement excessif ou réglage manuel. La structure définit la période — pas le trader.
POURQUOI LE SUPERTREND STRUCTUREL ?
Le Supertrend original change de direction lorsque le prix ferme au-delà de sa bande. Cela fonctionne bien dans des tendances claires mais crée une frustration courante : des faux signaux en conditions instables.
Le Problème
Une seule bougie volatile fermant légèrement au-delà de la bande déclenche un retournement — même lorsque la tendance générale reste intacte. Les traders utilisant le Supertrend original rencontrent souvent :
- Des faux signaux lors des phases de consolidation
- Des sorties prématurées de tendances valides
- Des ré-entrées à des prix moins favorables après de faux retournements
La Solution
Le Supertrend Structurel étend le concept original pour mieux refléter les changements structurels plutôt que la volatilité momentanée. Il filtre le bruit en attendant la confirmation qu’un véritable changement de direction a eu lieu.
Le résultat est moins de faux retournements et une meilleure correspondance avec les changements réels de tendance.
Pourquoi garder les deux ?
Le Supertrend original n’est pas inutile — il répond à une question différente.
- Structurel montre la tendance majeure (la « grande image »)
- Original montre les changements de momentum au sein de cette tendance (impulsion vs correction)
Lorsque les deux lignes s’alignent : forte conviction directionnelle. Lorsqu’elles divergent : le mouvement peut être correctif, pas un vrai retournement.
Cette vue à double couche vous donne un contexte que ni l’une ni l’autre ne fournit seule.
LE CONCEPT FONDAMENTAL
Les MM traditionnelles répondent à : « Quel est le prix moyen sur N barres ? »
Cet indicateur répond : « Quel est le prix moyen depuis le début de la tendance actuelle ? »
La MM est construite directement sur Supertrend :
- Supertrend détecte un retournement de tendance
- L’indicateur trouve la clôture extrême de la tendance précédente (plus haute pour une nouvelle tendance baissière, plus basse pour une nouvelle tendance haussière)
- La MM s’ancre à ce point et calcule jusqu’à la barre actuelle
- Lorsque Supertrend bascule à nouveau, la MM se réinitialise sur un nouvel ancrage
Le Supertrend définit la tendance. La MM la mesure. Ils fonctionnent comme un système unique — pas comme des outils séparés.
Vous choisissez quel Supertrend pilote la MM :
- Structurel — moins de réinitialisations, suit la tendance majeure
- Original — plus de réinitialisations, suit le momentum à court terme
CARACTÉRISTIQUES CLÉS
Analyse Double Supertrend
- Supertrend Structurel identifie la direction de la tendance majeure en utilisant un modèle Supertrend adapté structurellement
- Supertrend Original révèle le comportement impulsif vs correctif au sein de la tendance
- La comparaison visuelle montre quand les deux sont d’accord (conviction) ou divergent (prudence)
Moyenne Mobile Adaptative Basée sur un Ancrage
- La MM s’ancre automatiquement à la clôture extrême de la tendance précédente
- La période croît dynamiquement à partir du point d’ancrage — aucun réglage fixe requis
- Trois types de MM : Simple, Exponentielle, Arnaud Legoux (ALMA)
- Codée par couleur selon la direction de la tendance pour une reconnaissance instantanée du biais
Contexte Multi-Temporalités
- Appliquez le calcul de la MM au Supertrend d’une temporalité supérieure tout en visualisant des graphiques de temporalité inférieure
- Voir la MM de tendance quotidienne sur votre graphique H1 sans changer de temporalité
- Détection automatique des exigences en barres avec avertissements clairs
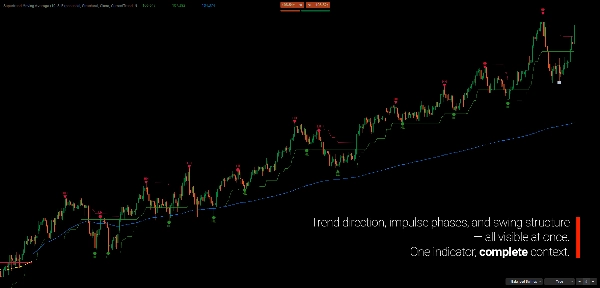
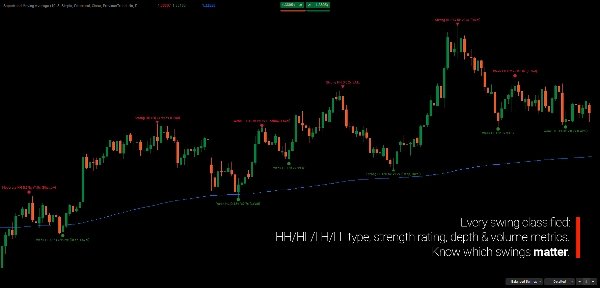
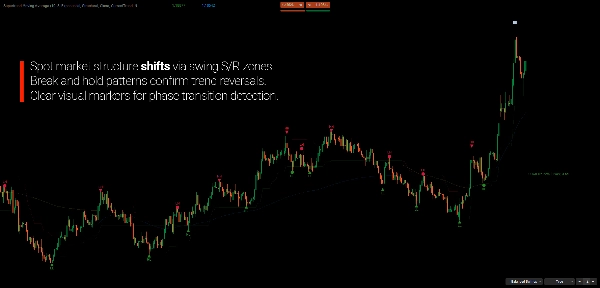
Détection de Swing Intégrée
- Trois modes de détection : Mineur, Équilibré, Majeur
- Classification de la force du swing (Faible, Modérée, Forte)
- Étiquettes HH/HL/LH/LL confirment la structure de la tendance
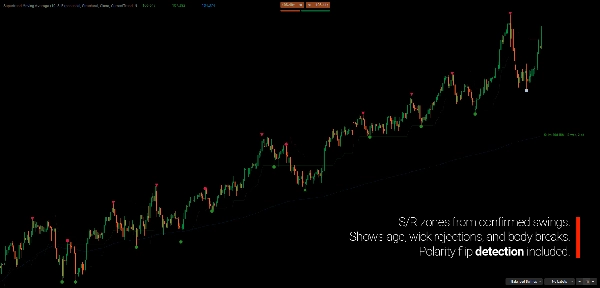
- Zones S/R optionnelles avec suivi du retournement de polarité
LIRE LE GRAPHIQUE
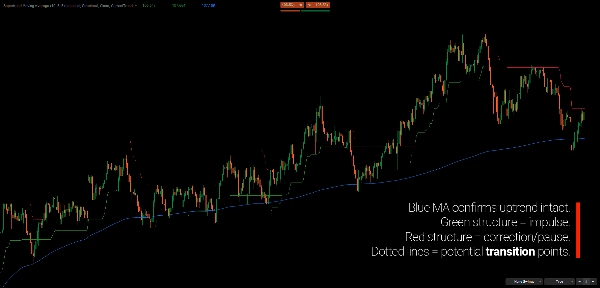
- Ligne de Structure Verte : Tendance structurelle haussière (support)
- Ligne de Structure Rouge : Tendance structurelle baissière (résistance)
- Ligne Pointillée : Supertrend Original — montre quand la structure diffère du classique
- MM Bleue : Moyenne de la tendance haussière depuis l’ancrage
- MM Jaune : Moyenne de la tendance baissière depuis l’ancrage
- Marqueurs de Swing : Points de retournement confirmés avec icônes de force
Vérification de l’Alignement de la Tendance :
- Structure + Original d’accord → Mouvement à forte conviction
- Structure + Original divergent → Correction ou transition potentielle
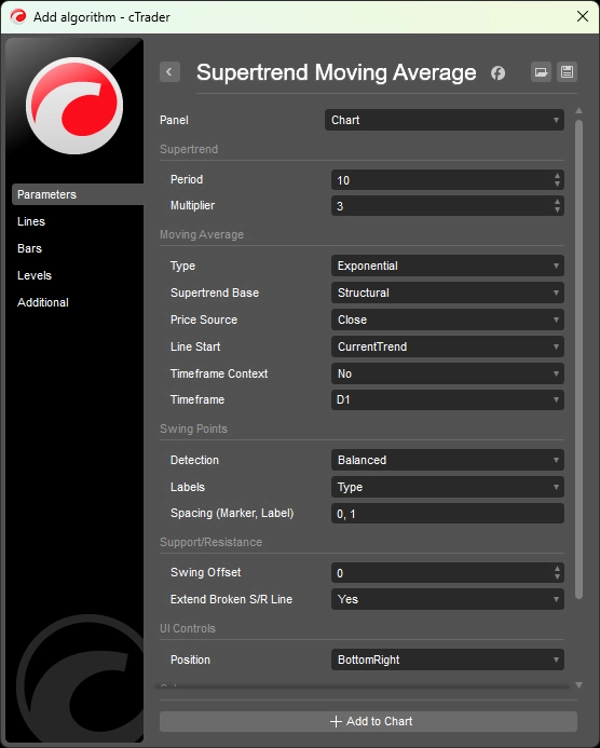
PARAMÈTRES
Supertrend
- Période (par défaut : 10)
- Multiplicateur (par défaut : 3.0)
Moyenne Mobile
- Type : Aucun, Simple, Exponentielle, Moyenne Mobile Arnaud Legoux (ALMA)
- Base Supertrend : Structurel (par défaut) ou Original
- Source du prix : Clôture, Ouverture, Haut, Bas, Médian, Typique, Moyenne
- Début de ligne : Tendance actuelle ou tendance précédente
- Contexte temporel : Activation/désactivation avec sélection de la temporalité
Points de Swing
- Mode de détection : Aucun, Mineur, Équilibré, Majeur
- Affichage des étiquettes : Aucun, Type (HH/LL), Détail
- Couleurs et espacements personnalisables
POUR QUI C’EST
Cet indicateur est conçu pour les traders qui pensent en termes de structure plutôt que de signaux.
Si vous vous souciez davantage de comprendre où vous vous situez dans une tendance que de chasser des entrées parfaites, cet outil a été conçu pour vous.
Il convient bien aux traders de tendance et de swing qui veulent une méthode objective pour suivre le développement de la tendance sans dépendre des moyennes mobiles à période fixe ou d’une optimisation constante des paramètres.
Les analystes multi-temporalités bénéficieront de voir le contexte structurel de temporalité supérieure directement sur les graphiques d’exécution, tandis que les traders discrétionnaires peuvent utiliser la MM ancrée comme référence dynamique pour les retracements, la continuation et l’épuisement de tendance.
Ce n’est pas un générateur de signaux plug-and-play. C’est un cadre contextuel pour les traders qui valorisent la clarté, la cohérence et la logique structurelle dans leur prise de décision.
CE QUI LE REND DIFFÉRENT
Les décisions de trading impliquent souvent un compromis familier : rapide mais bruyant, ou lisse mais tardif.
Cet indicateur s’adapte à la façon dont le marché se déroule réellement. Les tendances courtes produisent des MM réactives. Les tendances prolongées évoluent naturellement vers des MM plus lisses. Aucune optimisation n’est requise — la structure définit la période.
En comparant le Supertrend Structurel et Original, l’indicateur fournit un contexte clair pour distinguer la continuation de tendance du mouvement correctif au sein de la tendance.
---
COMPRENDRE LA STRUCTURE DU MARCHÉ
La structure du marché est l’étude de la façon dont le prix évolue à travers des séquences d’expansion et de contraction, plutôt que par des bougies ou indicateurs isolés. Les tendances ne sont pas définies par des mouvements uniques, mais par la relation entre les swings — des plus hauts plus hauts et des plus bas plus hauts dans les tendances haussières, des plus hauts plus bas et des plus bas plus bas dans les tendances baissières.
Dans cette perspective, une tendance n’est pas quelque chose à prédire, mais quelque chose à observer et valider. Ce qui importe n’est pas que le prix monte ou baisse sur la barre actuelle, mais si la structure sous-jacente reste intacte ou commence à se dégrader.
C’est pourquoi l’analyse basée sur la structure se concentre moins sur le timing des entrées parfaites et plus sur le contexte : où le marché se situe dans sa phase actuelle, si les mouvements sont impulsifs ou correctifs, et comment les nouvelles informations s’intègrent dans la structure existante.
Les indicateurs construits autour de la structure du marché ne sont pas destinés à remplacer la prise de décision, mais à soutenir une interprétation plus claire de ce que le prix communique déjà.
---
Le trading comporte des risques. Cet indicateur est un outil d’analyse technique — appliquez toujours une gestion appropriée des risques.
Résumé
The indicator integrates dual Supertrend analyses: a Structural Supertrend that identifies major trend direction by filtering out noise and confirming genuine directional changes, and the Original Supertrend that highlights momentum shifts within the trend. Comparing these two provides context for distinguishing strong trend continuation from corrective movements.
Key features include:
- Adaptive anchor-based moving averages with options for Simple, Exponential, or Arnaud Legoux (ALMA) types.
- Multi-timeframe capability to apply higher timeframe Supertrend context on lower timeframe charts.
- Integrated swing detection with configurable modes and strength classification.
- Color-coded trend lines and swing markers for clear visual interpretation.
This tool is suited for trend and swing traders, multi-timeframe analysts, and discretionary traders seeking a structural framework to track trend development and market rhythm objectively. It emphasizes market structure and context over fixed signals, supporting clearer interpretation of price behavior.
Avis clients
5 | 100 % | |
4 | 0 % | |
3 | 0 % | |
2 | 0 % | |
1 | 0 % |


