
Description
🧭 Synchronisez vos transactions avec l'horloge : Atlas révèle quand les marchés ont tendance à bouger par mois, jour de la semaine et heure. 🧭
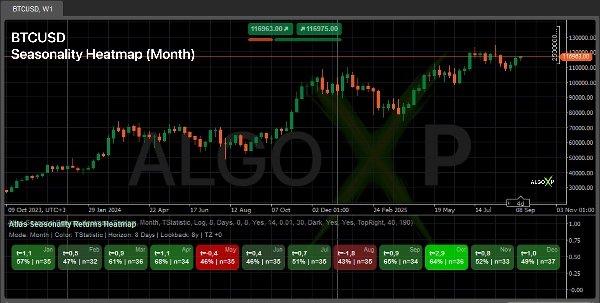
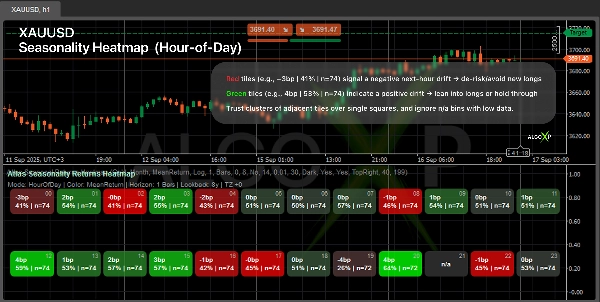
Voyez quand votre marché a tendance à bouger — par Mois, Jour de la semaine ou Heure de la journée.
Atlas calcule les rendements futurs sur un horizon que vous choisissez et affiche une carte thermique symétrique (Bas → Zéro → Haut). Chaque case montre une métrique (Moyenne, T-stat, ou Sharpe) plus hit% | n. Utilisez-le pour synchroniser les entrées/sorties, planifier les sessions, et filtrer le risque.
🎯 Pourquoi les traders l'utilisent
- Repérez les fenêtres vertes pour s'engager et les fenêtres rouges pour se retirer.
- Planifiez les sessions autour des heures/jours statistiquement favorables.
- Ajoutez une couche propre “quand” aux stratégies discrétionnaires et systématiques.
⚙️ Comment ça fonctionne
- Regarde en avant sur une fenêtre que vous choisissez et résume comment le prix a tendance à se comporter dans cette fenêtre.
- Regroupe les résultats en tranches temporelles (Mois / Jour de la semaine / Heure) et respecte votre fuseau horaire.
- Applique une protection contre les valeurs aberrantes et un score de robustesse par tranche (plus la taille de l'échantillon).
- Affiche une carte thermique équilibrée autour du neutre en utilisant vos couleurs Haut / Zéro / Bas.
👥 Pour qui c'est
- Traders discrétionnaires — meilleur timing et dimensionnement par session.
- Constructeurs de systèmes et bots — une couche de filtrage temporel / dimensionnement temporel pour les stratégies.
- Traders crypto et indices — motifs comportementaux rapides sur les jours/heures.
- Débutants — lecture simple : plus vert = biais plus positif sur l'horizon choisi.
🚀 Démarrage rapide
- Choisissez Préréglage d'actif (Forex/Crypto/Indice/Or).
- Définissez l'Horizon (par exemple, 1 Heure pour HOD, 1 Jour pour DOW/Mois).
- Ajustez la période d'observation, le nombre minimum d'observations, et les couleurs.
- Lisez les clusters (plusieurs cases vertes/rouges adjacentes) pour les signaux les plus forts.
ℹ️ La saisonnalité n'est pas une garantie de résultats futurs. C'est un motif statistique qui dépend de la période et de la méthodologie. Utilisez l'indicateur comme contexte pour vos règles d'entrée/sortie et la gestion des risques, testez la robustesse sur plusieurs fenêtres d'observation, et évitez de vous fier aux classes avec faible n (taille d'échantillon).
Résumé
The indicator supports multiple asset presets including Forex, Crypto, Indices, and Commodities, and respects the user’s timezone. It applies outlier protection and calculates a robust strength score per time bucket to ensure reliable insights. Users can customize parameters like lookback period, minimum observations, and color schemes.
Atlas is suitable for discretionary traders seeking better timing and sizing, system and bot builders needing a time-based filter or sizing layer, crypto and index traders analyzing behavioral patterns, and beginners looking for a straightforward indication of positive or negative market bias. It provides a statistical context for entry/exit decisions and risk management but should be used alongside other analysis tools.
Avis clients
5 | 50 % | |
4 | 50 % | |
3 | 0 % | |
2 | 0 % | |
1 | 0 % |


